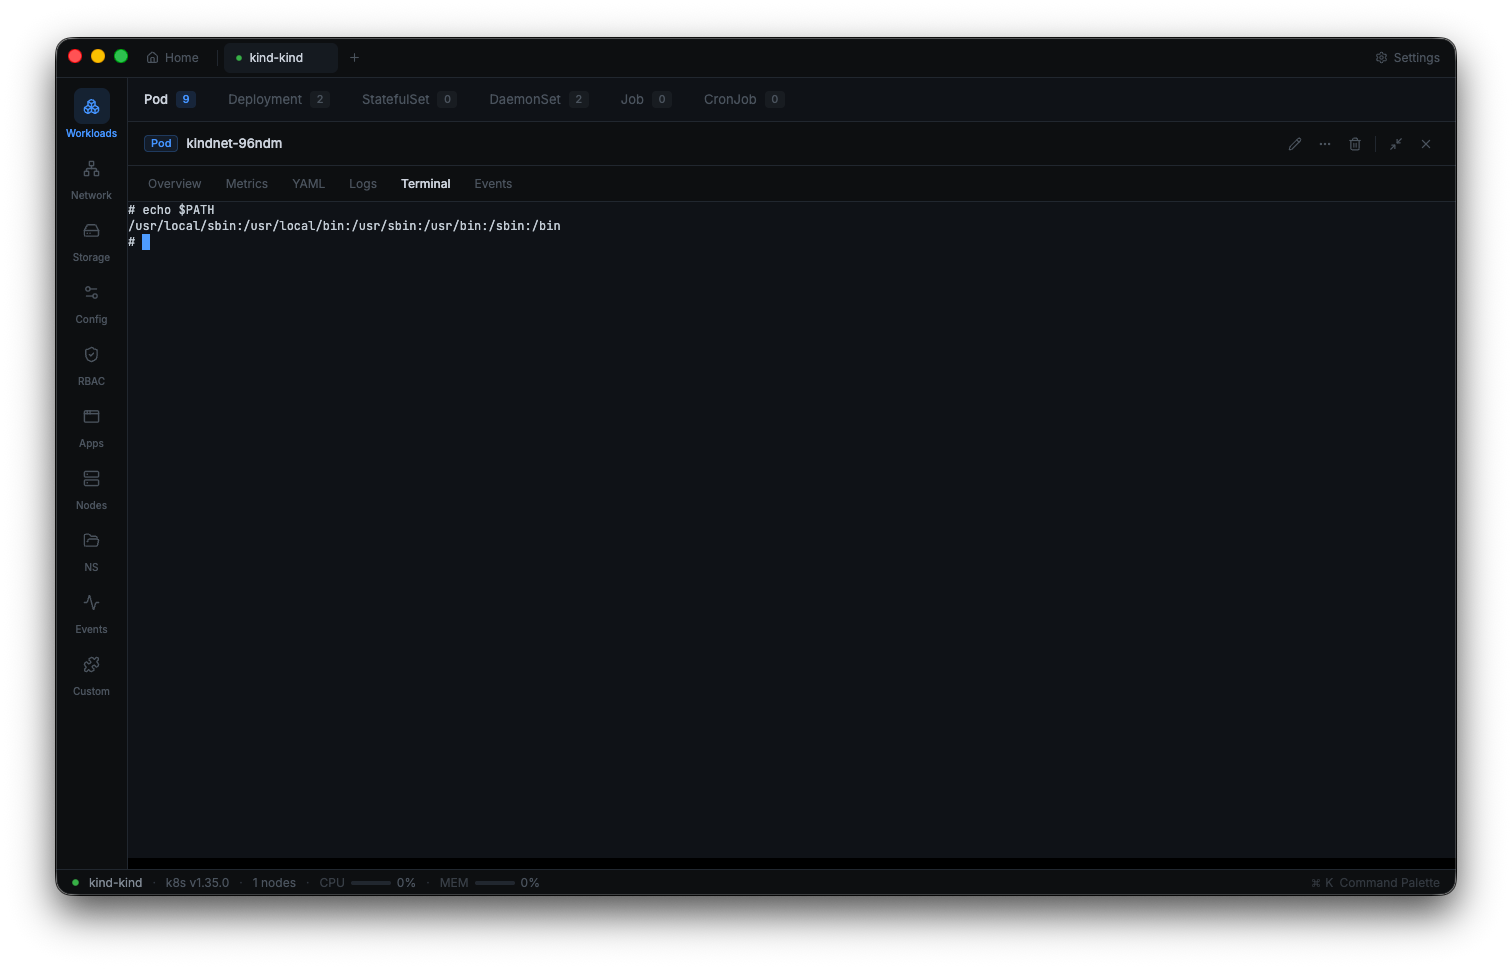
Pod Terminal
Interactive exec into any container with xterm.js. Multi-container selection, stdin/stdout streaming, automatic terminal resize, and tabbed session management.
Stop switching between kubectl, dashboards, and monitoring tools. Kuberniq gives you real-time visibility and full control over your clusters in a single desktop app.
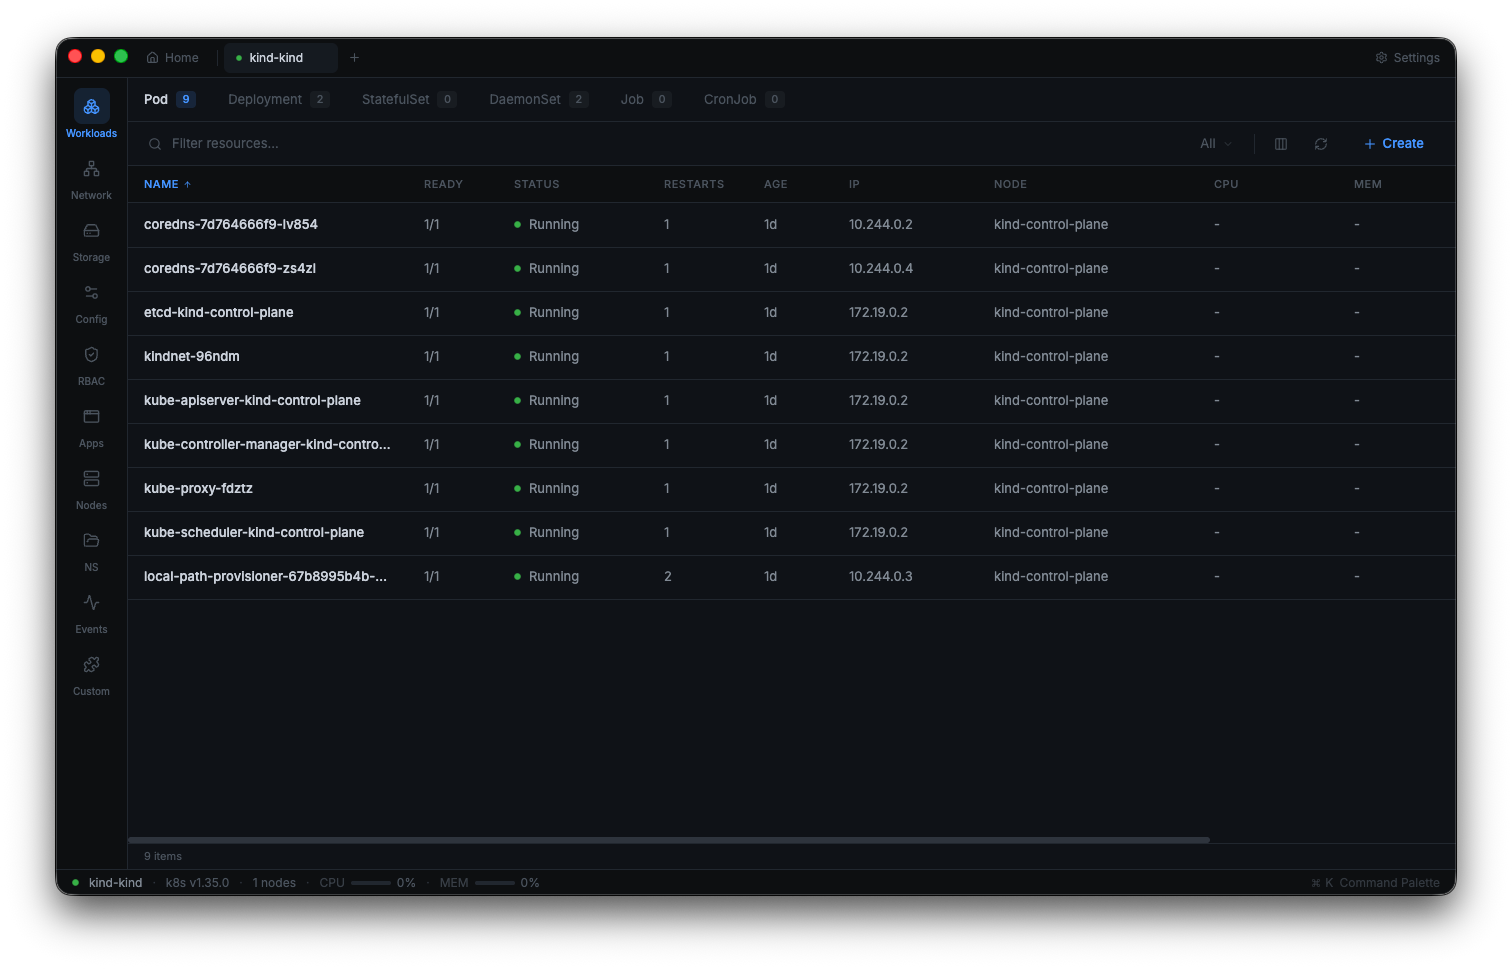
From resource management to Helm deployments, from pod debugging to cluster monitoring — Kuberniq handles it all.
Terminal, logs, editor, Helm, metrics, port forwarding, and more — all built in, ready to go.
Interactive exec into any container with xterm.js. Multi-container selection, stdin/stdout streaming, automatic terminal resize, and tabbed session management.
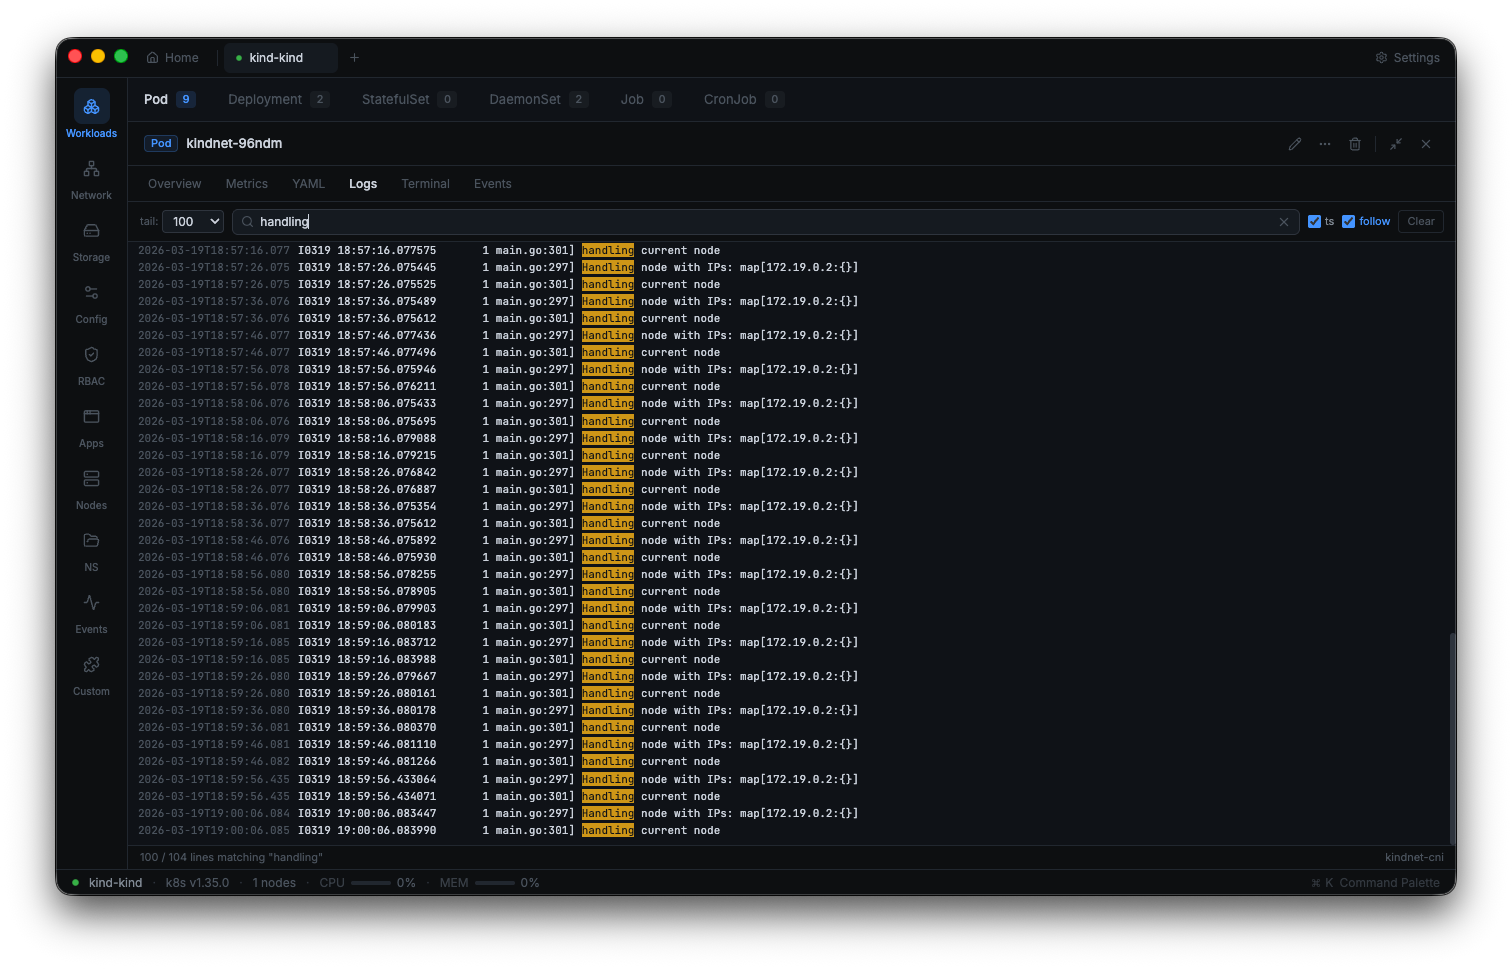
Follow, search, and filter container logs in real time. Up to 10,000 lines of history with timestamp toggle and previous container support.
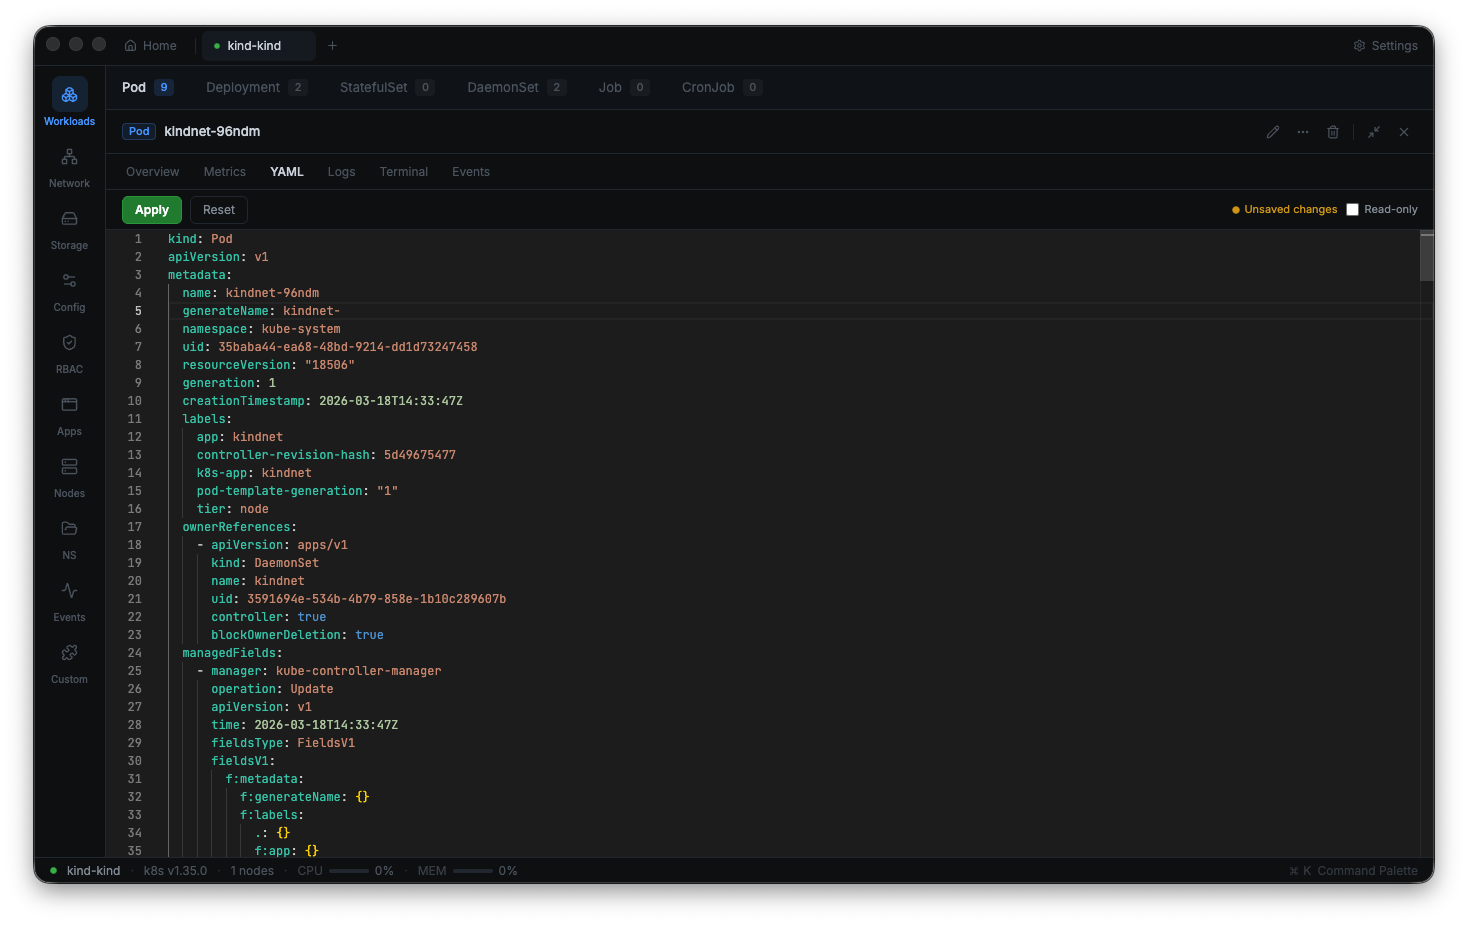
Monaco-powered editor with Kubernetes schema validation, syntax highlighting, and code completion. Apply changes directly to your cluster.
CPU and memory charts with Prometheus and metrics-server support. Configurable time ranges from 15 min to 24 hours with 24h history buffer.
Browse, install, upgrade, rollback, and uninstall Helm charts. 15 pre-configured repos (Bitnami, Prometheus, Grafana, Ingress-Nginx, and more).
Forward local ports to pods with intelligent suggestions from pod specs. Manage multiple simultaneous sessions with one-click control.
Jump to any resource with Ctrl+K. Fuzzy search across your entire cluster with recent history and feature commands.
Browse PVC and pod filesystem contents with permissions, sizes, and timestamps. Download and inspect files directly from running containers.
WebSocket-powered watch streams keep every resource table, status indicator, and event feed in sync with your cluster in real time.
Connect to every context in your kubeconfig — local, EKS, GKE, AKS, or on-prem. Tabbed interface with connection status, server version, and node count per cluster.
Automatic discovery and indexing of every CRD in your cluster on connect. Browse, inspect, edit, and delete custom resources with the same power as built-in types.
Health Monitor, Resource Graph, Batch Scaler, and Prometheus Metrics — powerful features built right into Kuberniq, ready to use out of the box.
Deep-dive into the tools that make Kuberniq a full-featured IDE, not just another dashboard.
Interactive shell access to any container with xterm.js emulation. Select between init, sidecar, and ephemeral containers — with full stdin/stdout streaming and automatic resize.
Follow container logs as they happen, search through history, and toggle timestamps. Up to 10,000 lines buffered per stream with configurable tail settings.
Monaco-powered editor with full Kubernetes schema validation, intelligent completion, and syntax highlighting. Edit any resource and apply changes directly.
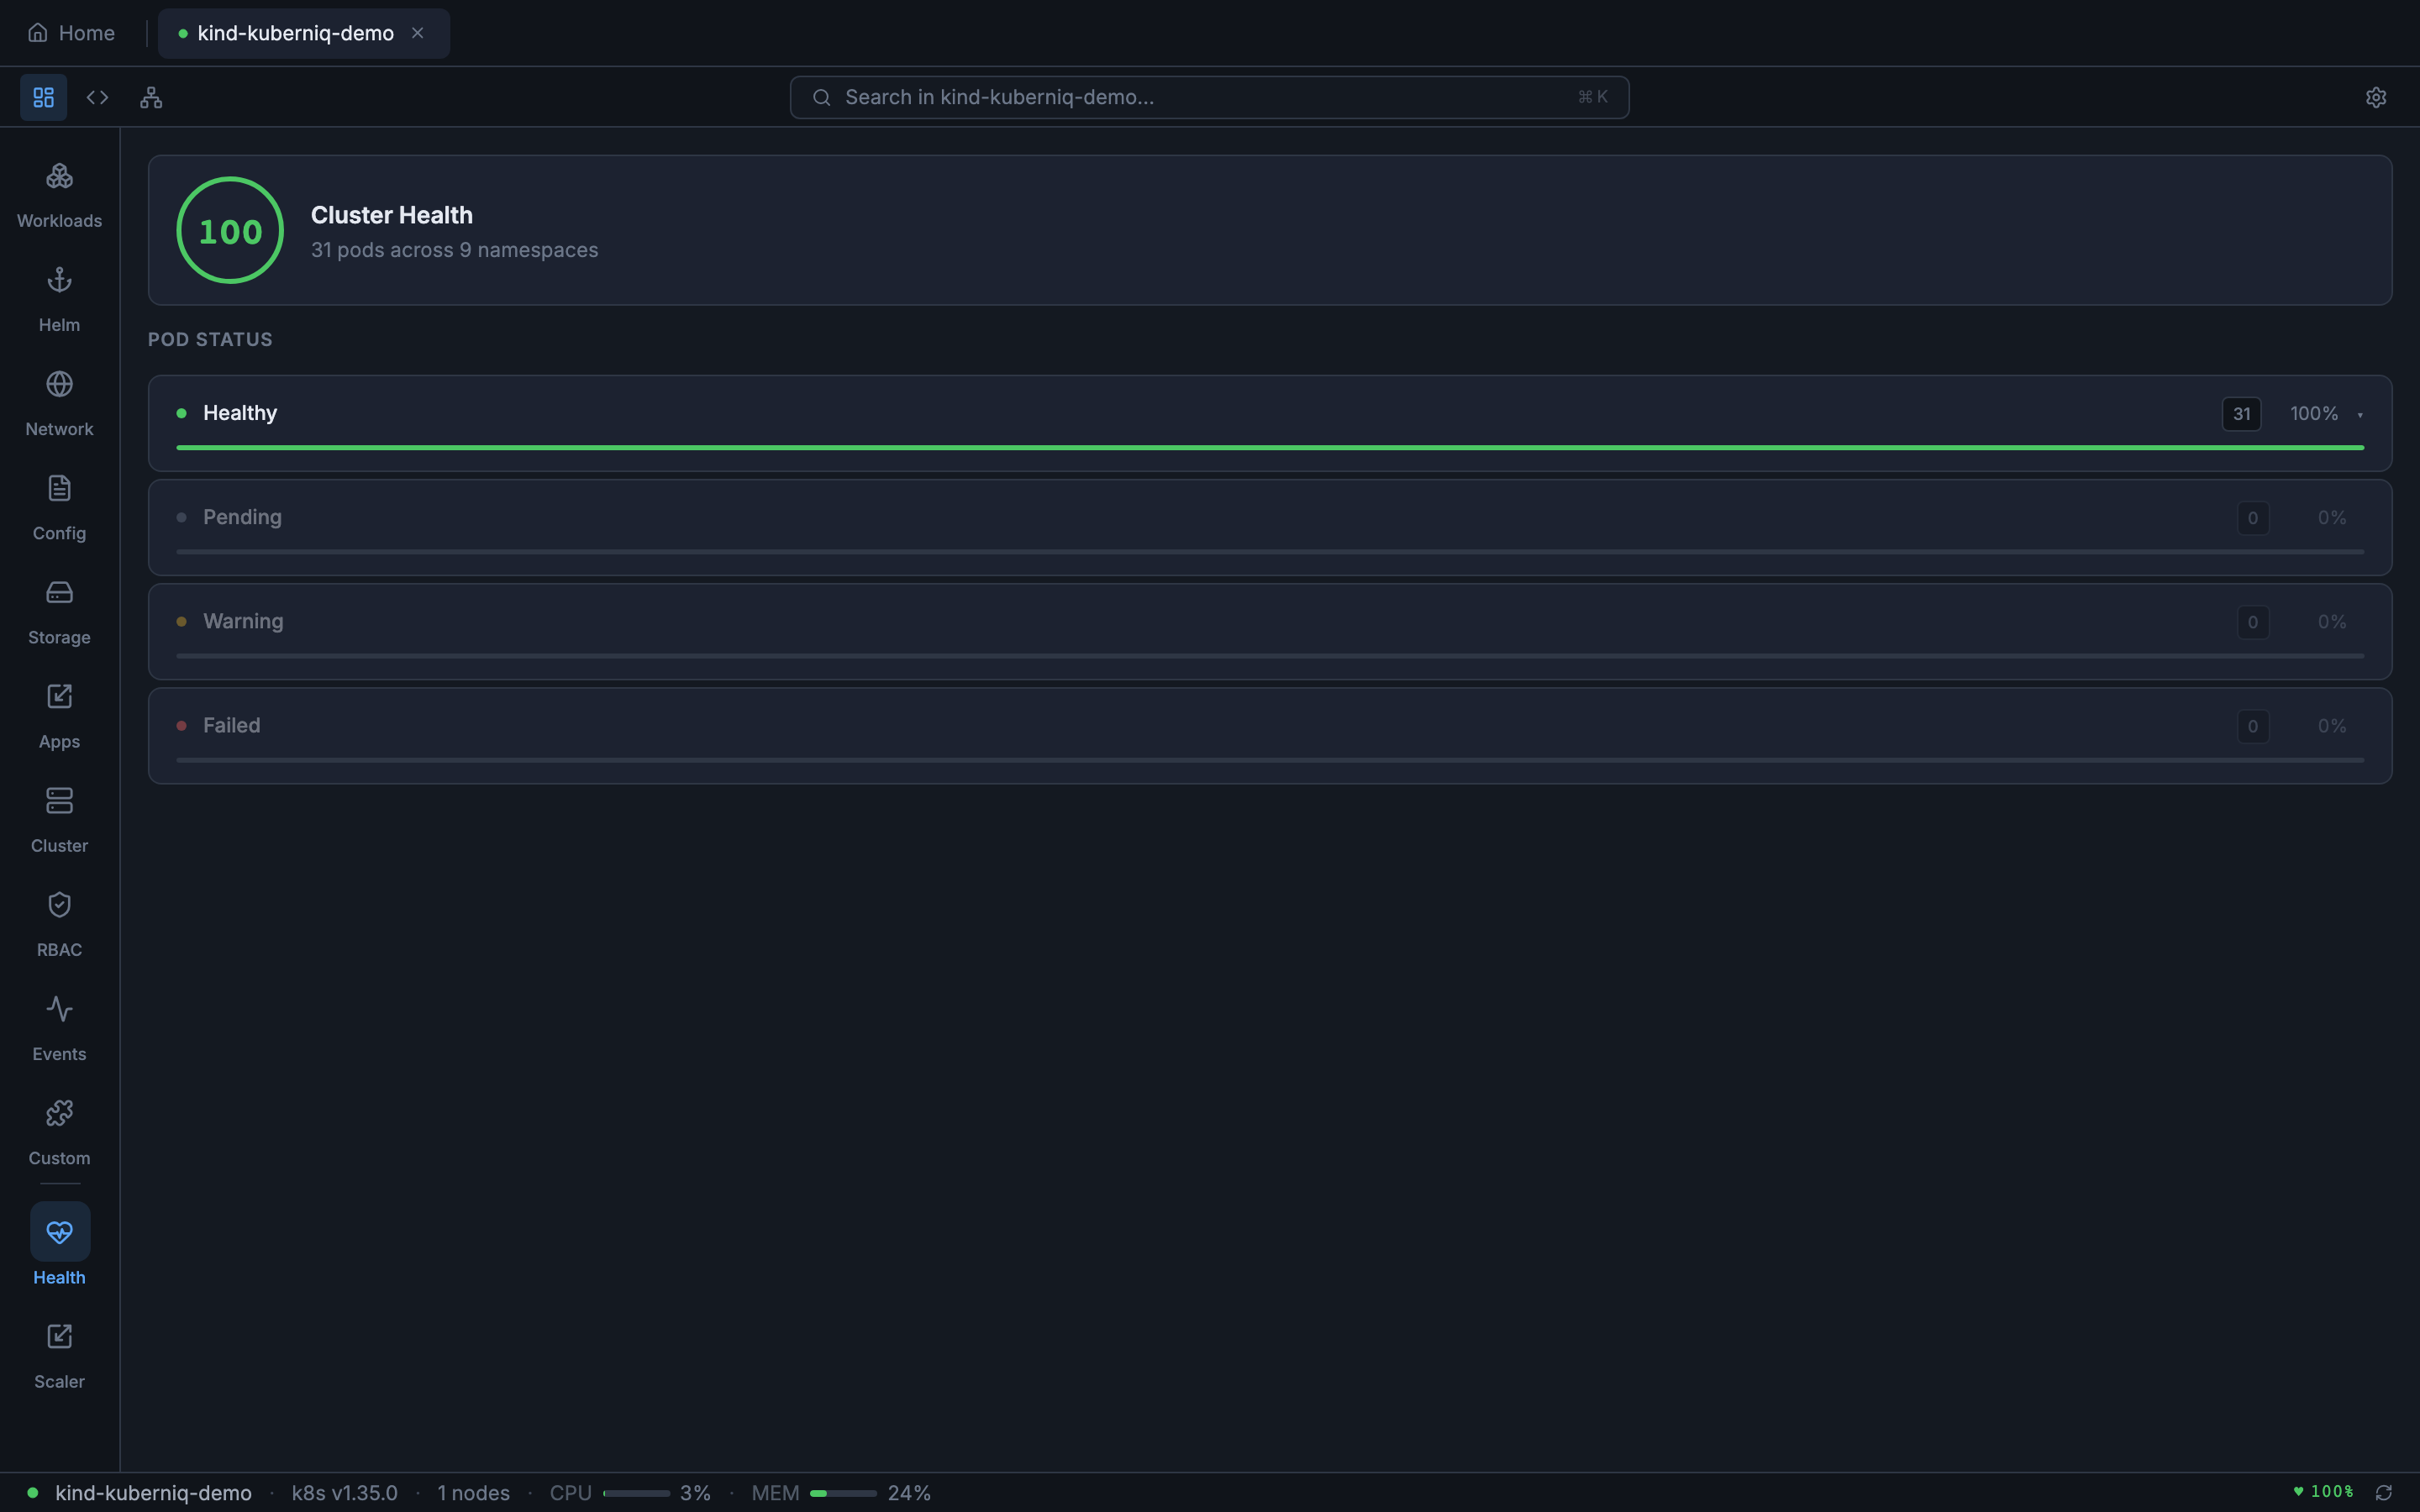
Real-time pod health classification with cluster health score. Instantly see which pods are healthy, pending, warning, or failed — with restart tracking and continuous status bar monitoring.
Browse, inspect, and manage every built-in resource type — plus any CRD installed in your cluster.
Run a single command to install on any platform.
curl -fsSL https://kuberniq.dev/install.sh | bashcurl -fsSL https://kuberniq.dev/install.sh | bashirm https://kuberniq.dev/install.ps1 | iexDownload Kuberniq and get the full power of Kubernetes management on your desktop.