Log Streaming
Kuberniq streams container logs in real-time over WebSocket, giving you a live view of your application output without leaving the IDE. The log viewer supports search highlighting, configurable tail lines, timestamp toggling, and multi-container selection.
Viewing Logs
To view logs, select a pod (or a workload resource like a Deployment) in the resource table and click the Logs tab in the detail panel. Kuberniq immediately opens a streaming connection and begins displaying log output as it arrives from the container.
For workload resources (Deployments, StatefulSets, DaemonSets), Kuberniq resolves the underlying pods and lets you select which pod and container to stream from.
Follow Mode
By default, the log viewer runs in follow mode: new log lines appear at the bottom and the
view auto-scrolls to keep the latest output visible. This is equivalent to
kubectl logs -f. You can pause follow mode by scrolling up in the log output.
When paused, a "Jump to bottom" button appears so you can resume following at any time.
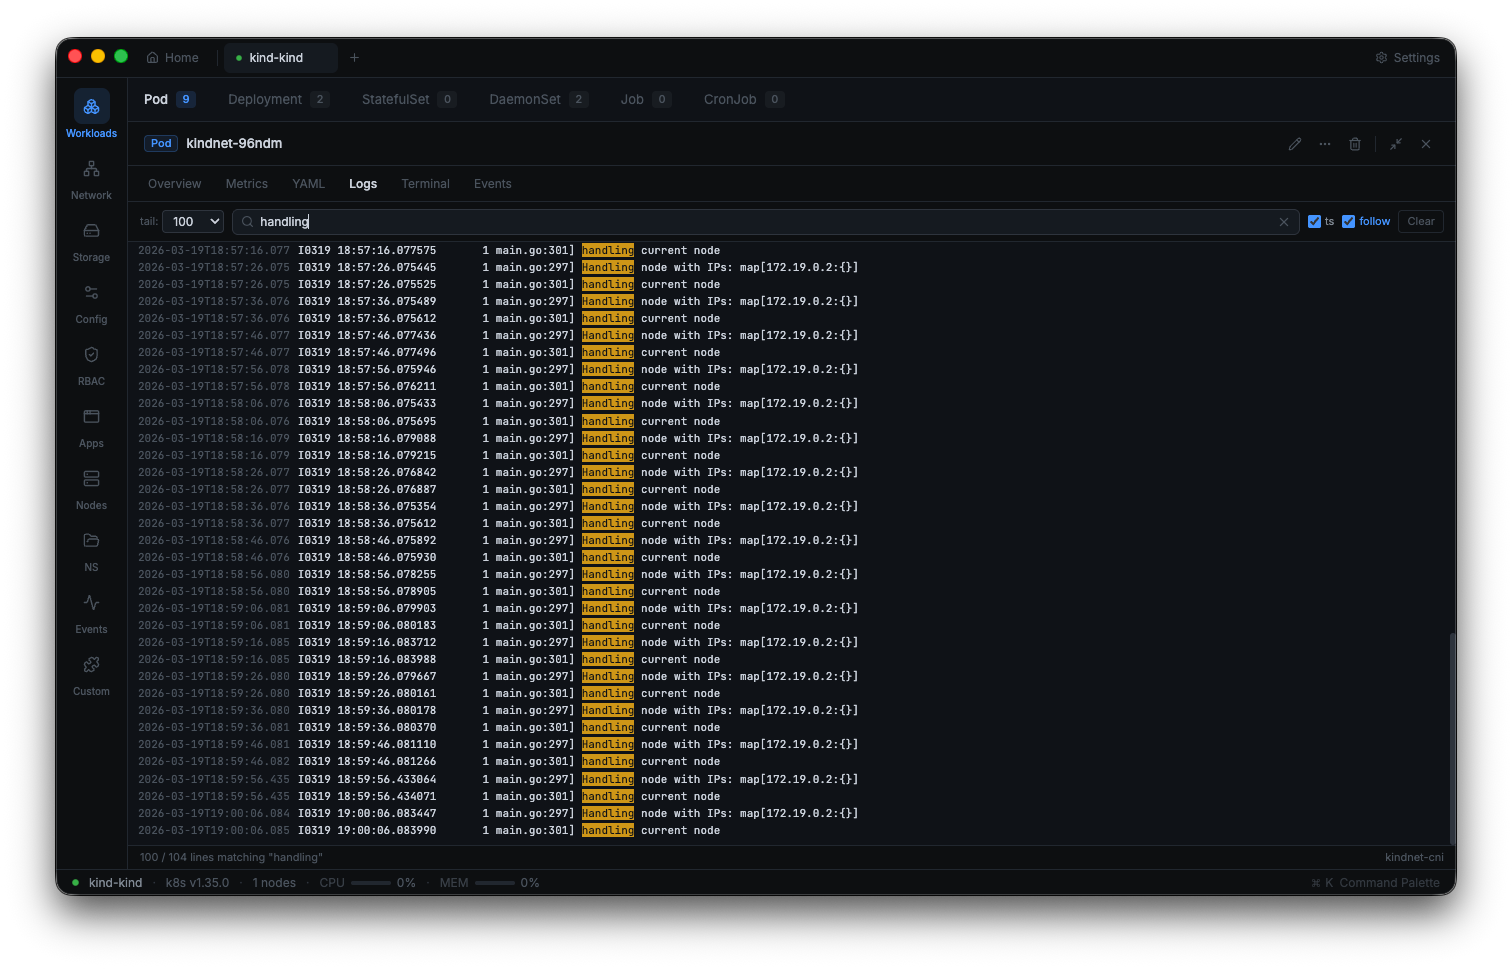
Search
The search bar at the top of the log viewer lets you filter and highlight log lines. As you type, matching text is highlighted across the entire log buffer. This makes it easy to find specific error messages, request IDs, or stack traces in a large volume of logs.
Log Buffer
Kuberniq buffers up to 10,000 lines per log stream in memory. When the buffer is full, the oldest lines are discarded to make room for new ones. This keeps memory usage bounded while still providing a substantial log history. The current line count is displayed in the log viewer header.
Tail Lines
When starting a log stream, you can configure how many historical lines to fetch from the Kubernetes API. Available options:
- 100 lines — Quick look at recent output (default)
- 500 lines — More context for debugging
- 1,000 lines — Extended history
- All — Fetch the entire available log (may take longer for containers with extensive output)
Timestamps
Toggle the timestamp display to show or hide timestamps prepended to each log line. Timestamps are in the format returned by the Kubernetes API (RFC 3339 with nanosecond precision). When enabled, each line is prefixed with its timestamp, making it easy to correlate events across containers or with external monitoring systems.
Container Selection
For pods with multiple containers, a dropdown lets you choose which container to stream logs from. The selector lists all containers in the pod, including:
- Main containers — The primary application containers
- Init containers — Startup containers (logs available after completion)
Switching containers immediately stops the current stream and starts a new one for the selected container.
Previous Container Logs
When a container has crashed or been restarted, you can view the logs from the previous
instance by enabling the "Previous" toggle. This is equivalent to
kubectl logs --previous and is invaluable for diagnosing crash loops and
OOM kills. The previous container logs show the output from the last terminated instance
of the container, up to the Kubernetes API's retention limit.
Reconnection
If the WebSocket connection is interrupted, Kuberniq automatically reconnects the log stream using exponential backoff. The reconnection strategy starts with a 1-second delay, doubling on each attempt up to a maximum of 30 seconds. Once reconnected, the stream resumes from the latest available log output. A visual indicator shows the connection state so you know when logs are live versus when a reconnection is in progress.