Resource Management
Kuberniq provides full CRUD operations for over 28 built-in Kubernetes resource types, organized into logical sidebar categories. Resources update in real-time via WebSocket watch streams, so you always see the current state of your cluster without manual refreshing.
Resource Categories
The sidebar organizes resources into the following categories:
Workloads
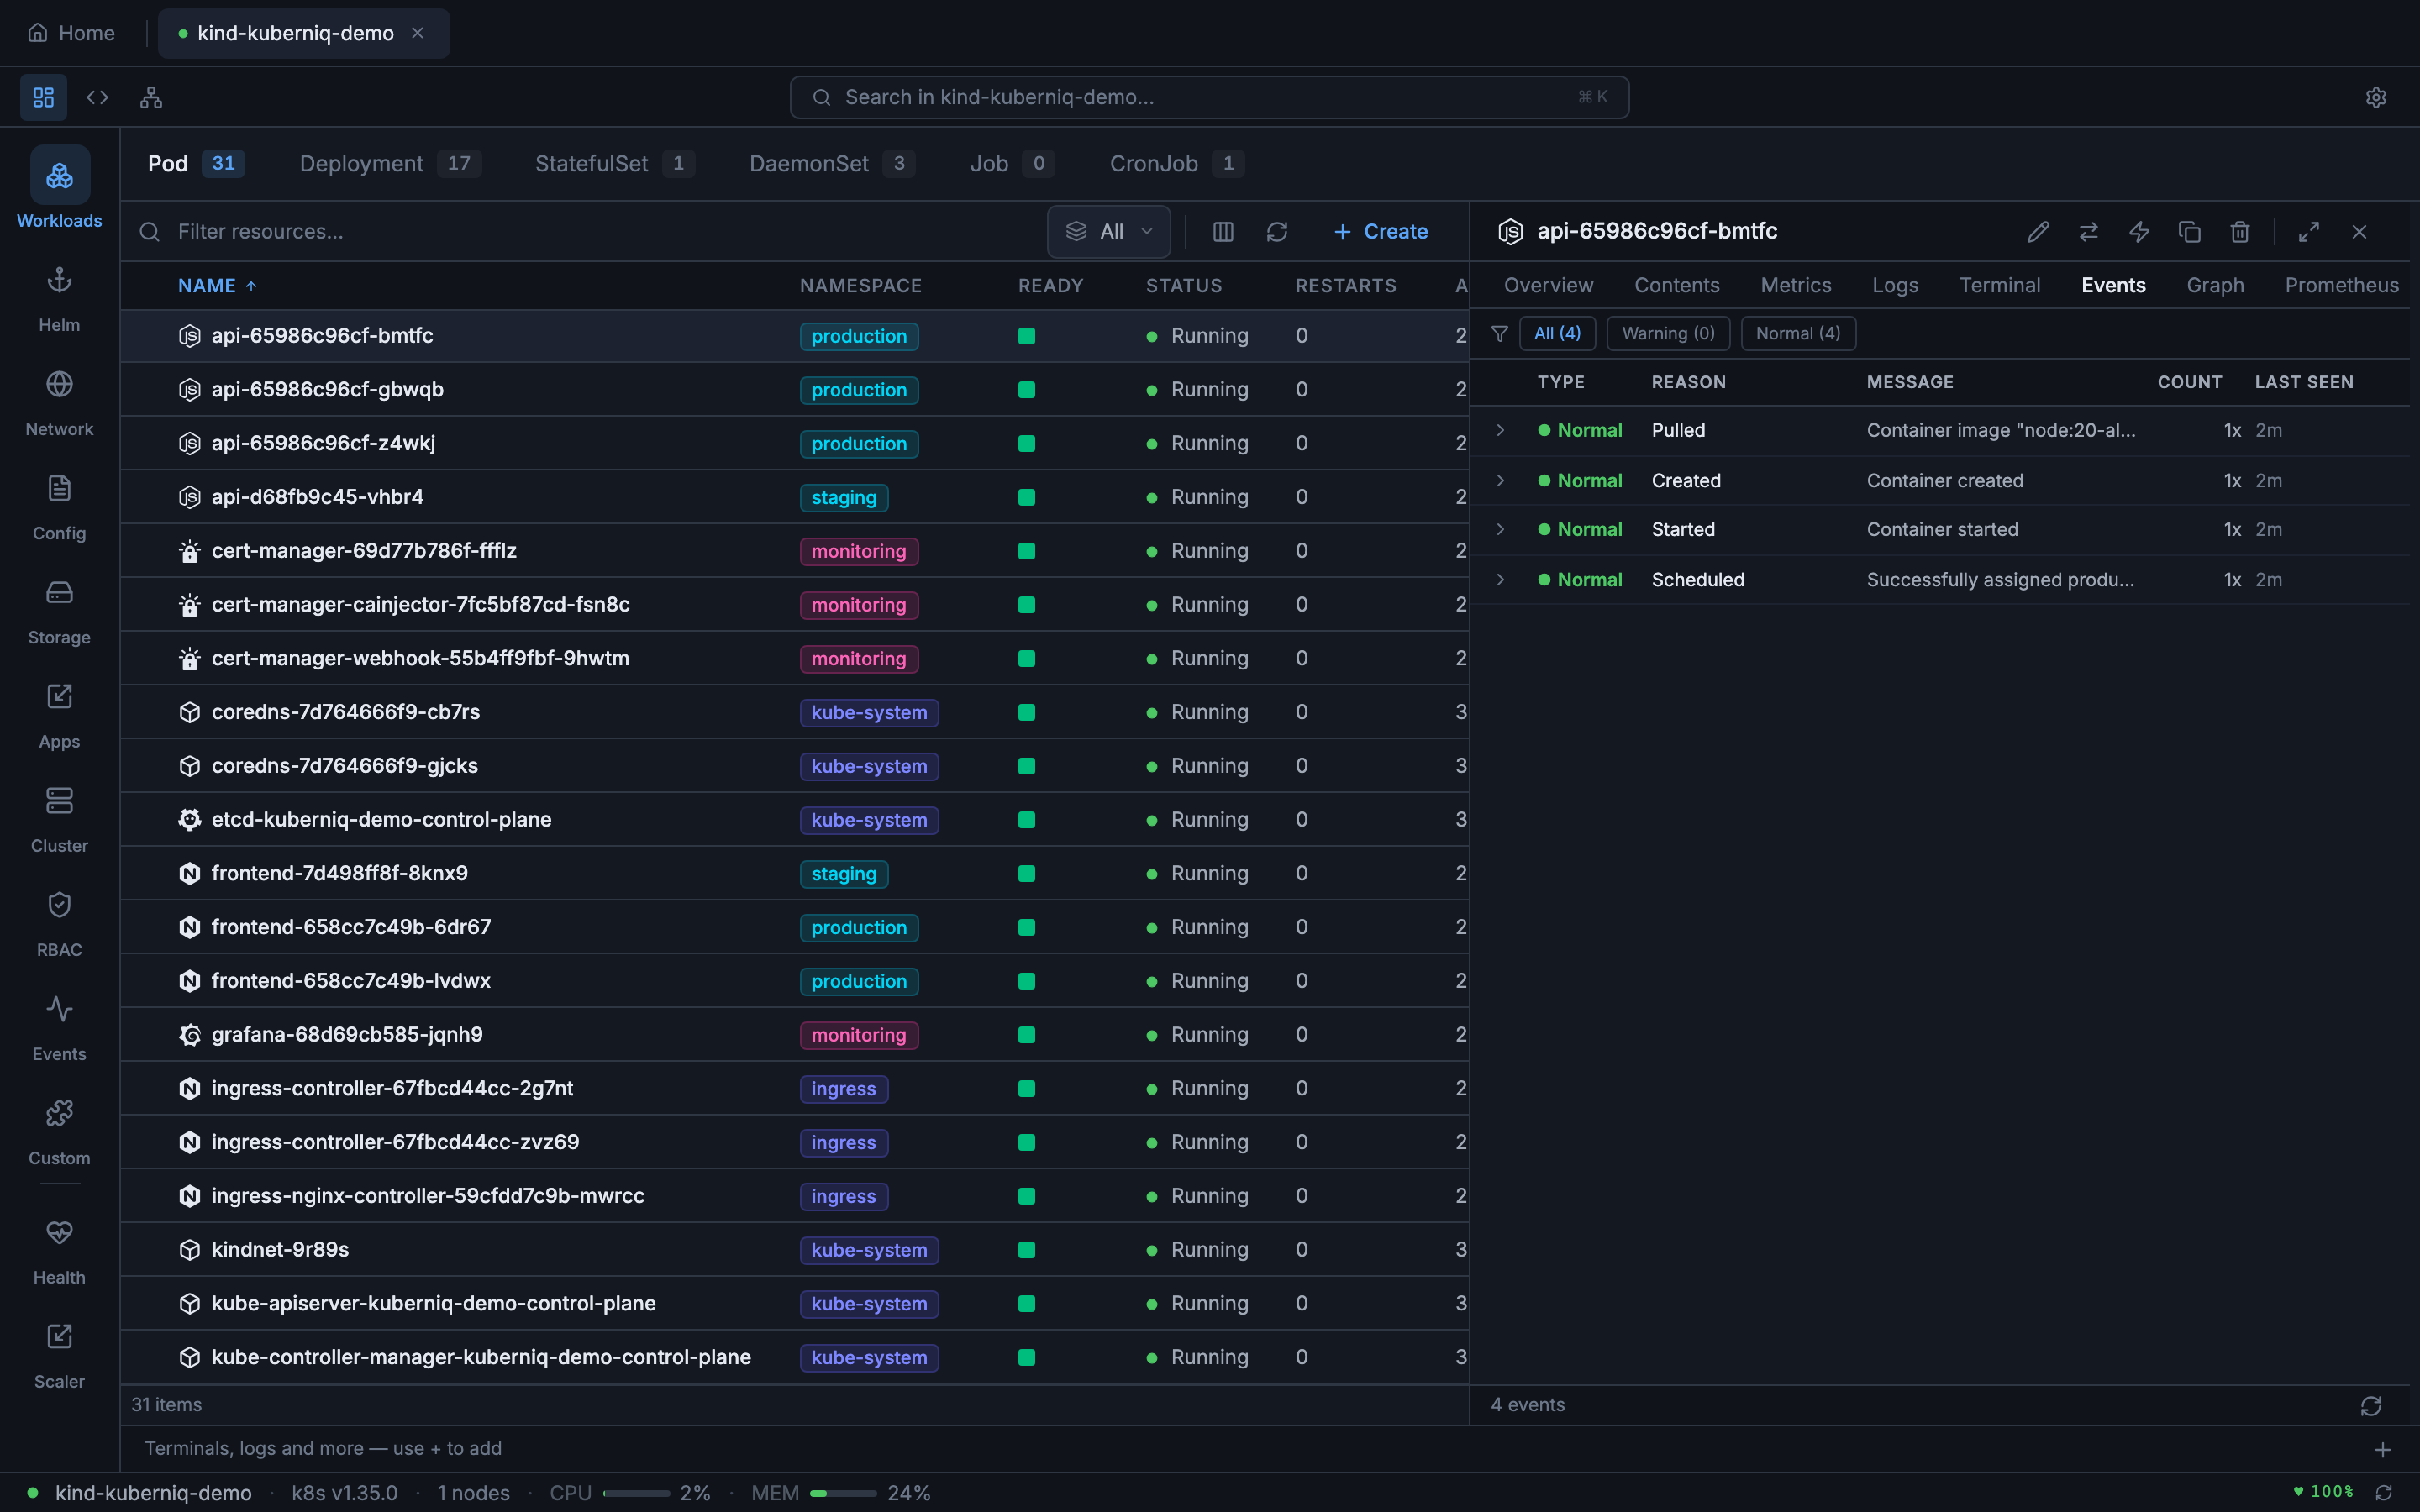
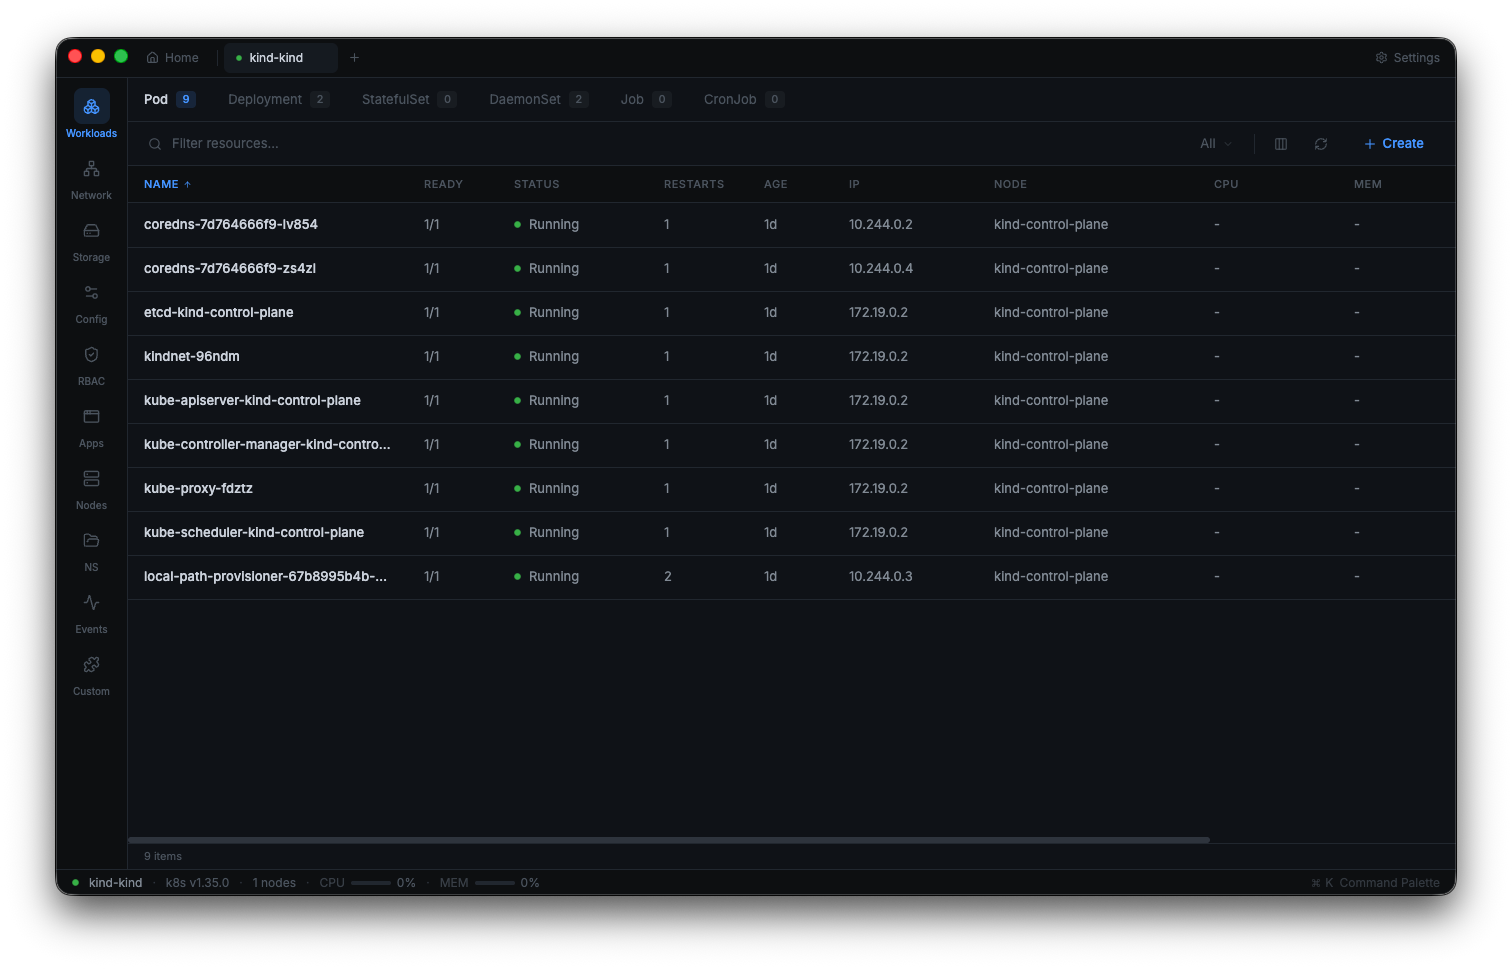
- Pods — Running containers with ready/total indicators, restart counts, and node placement
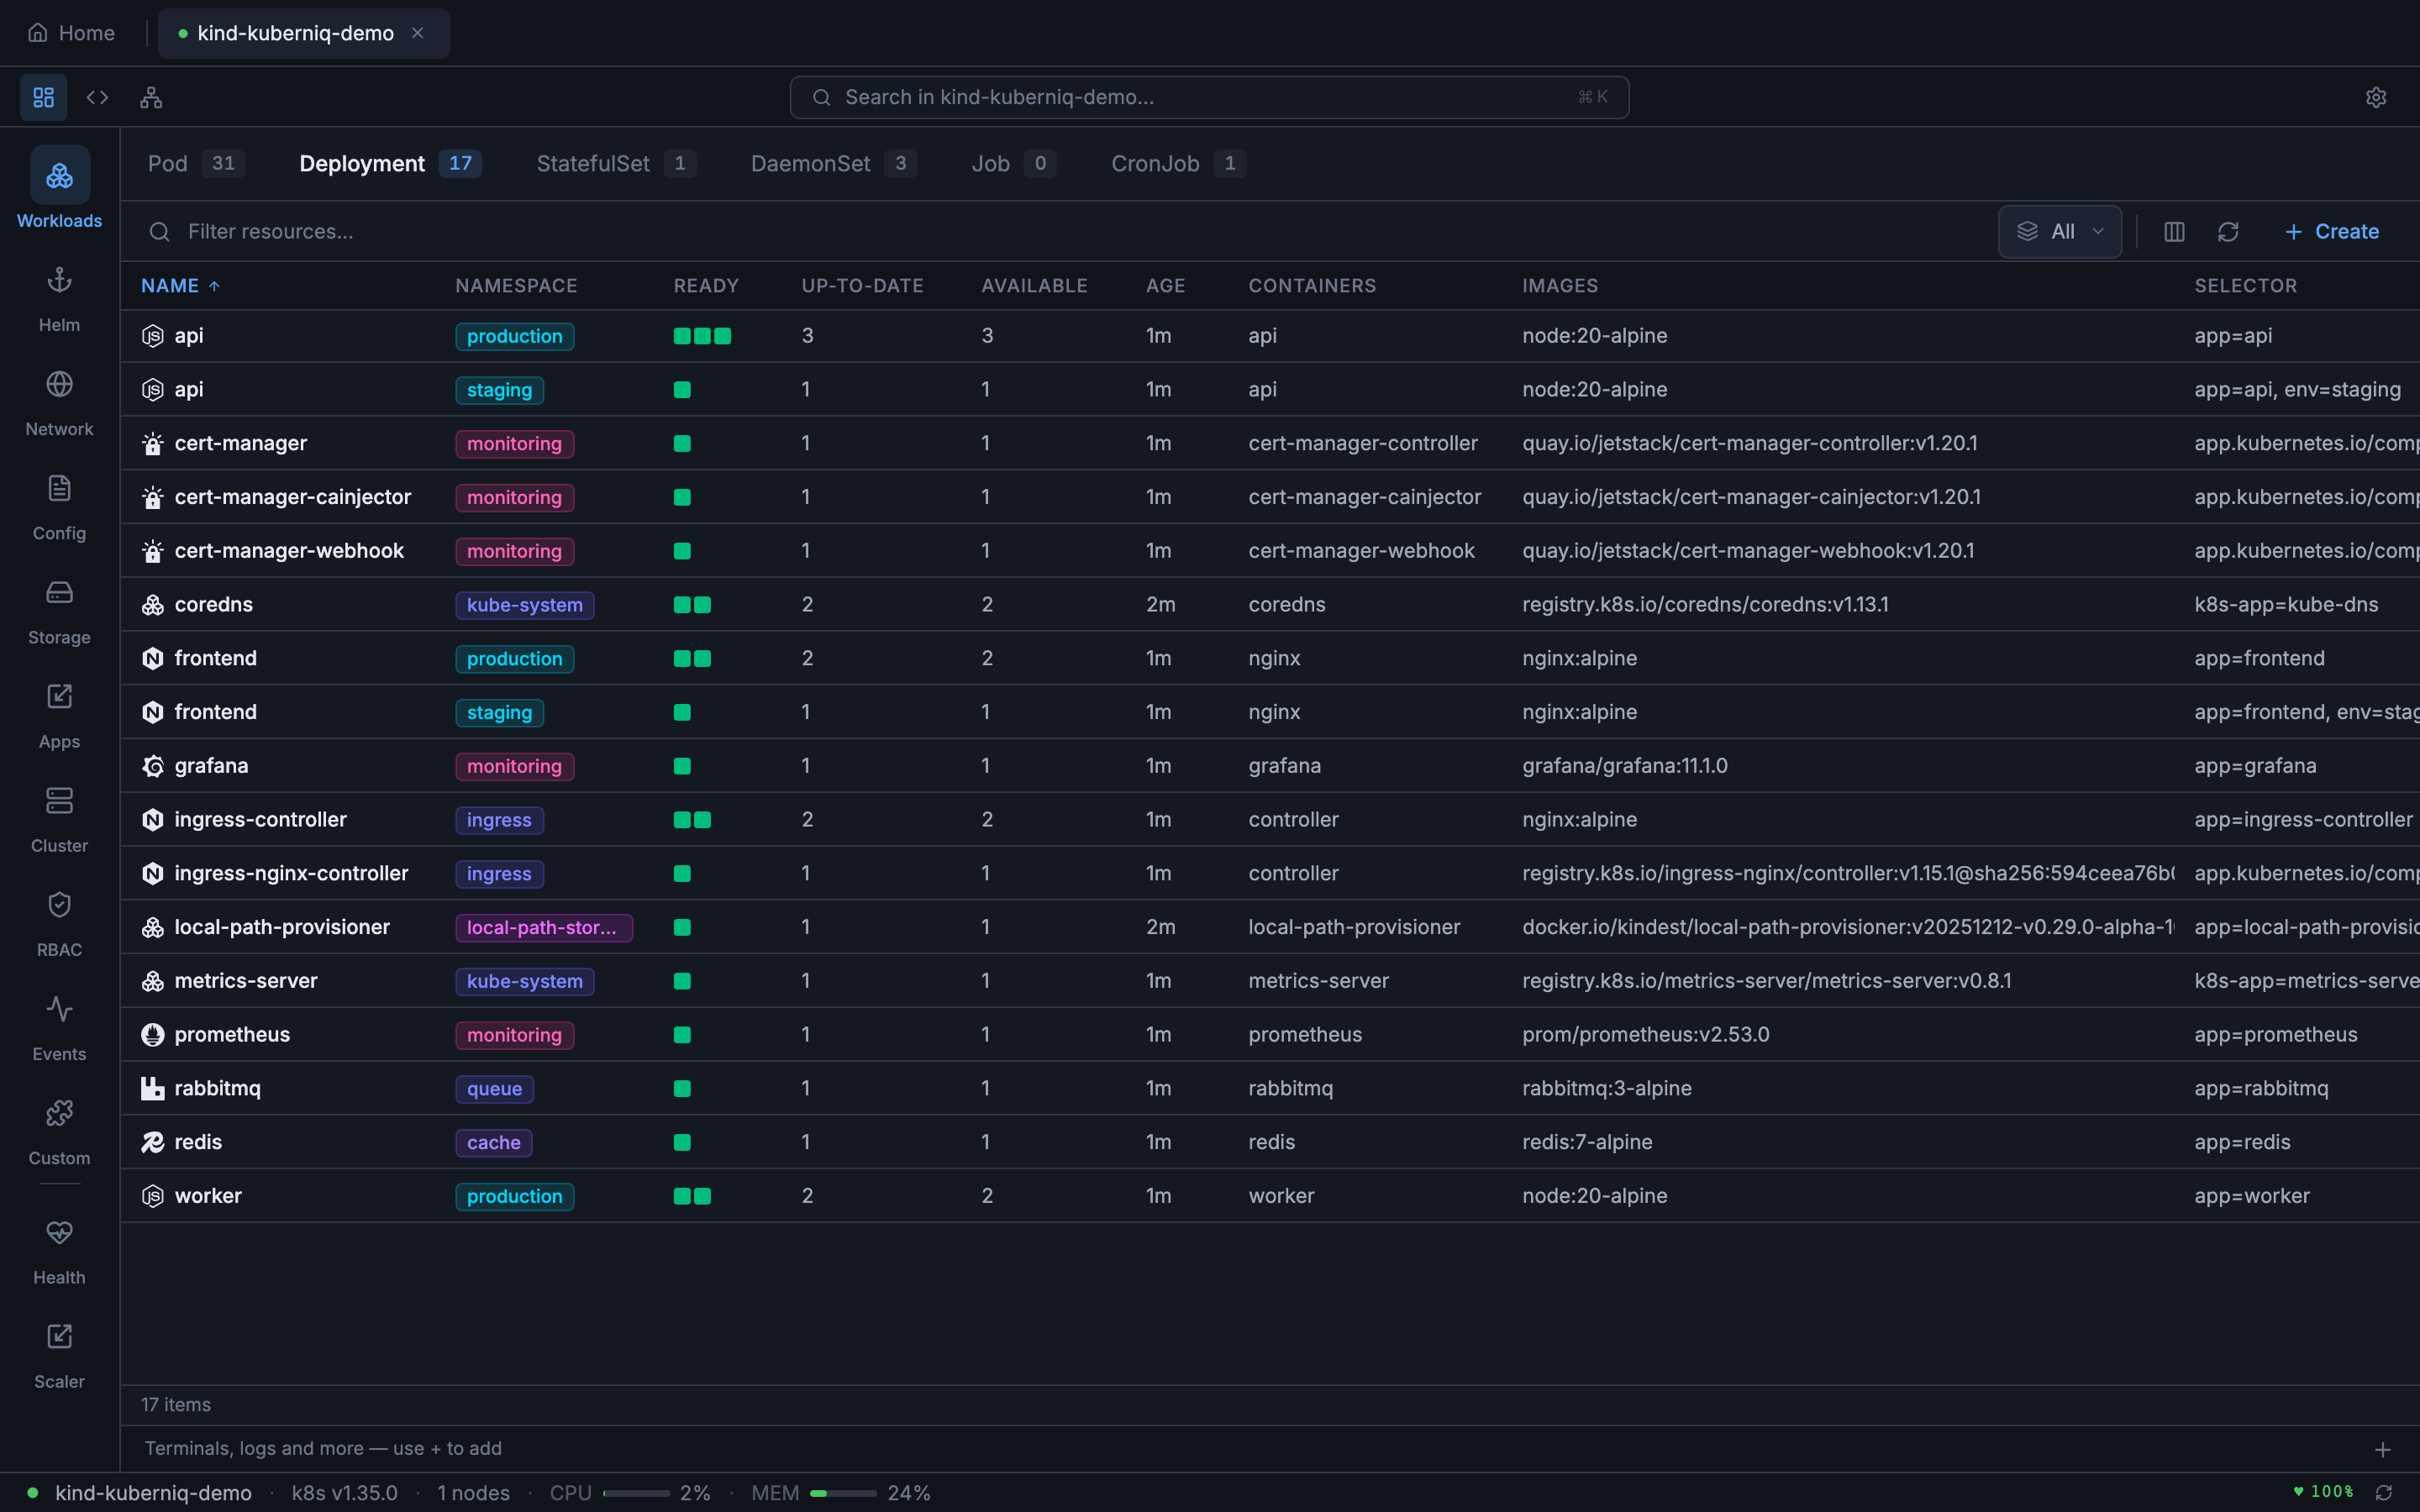
- Deployments — Desired vs. ready replica counts, rollout status, and strategy type
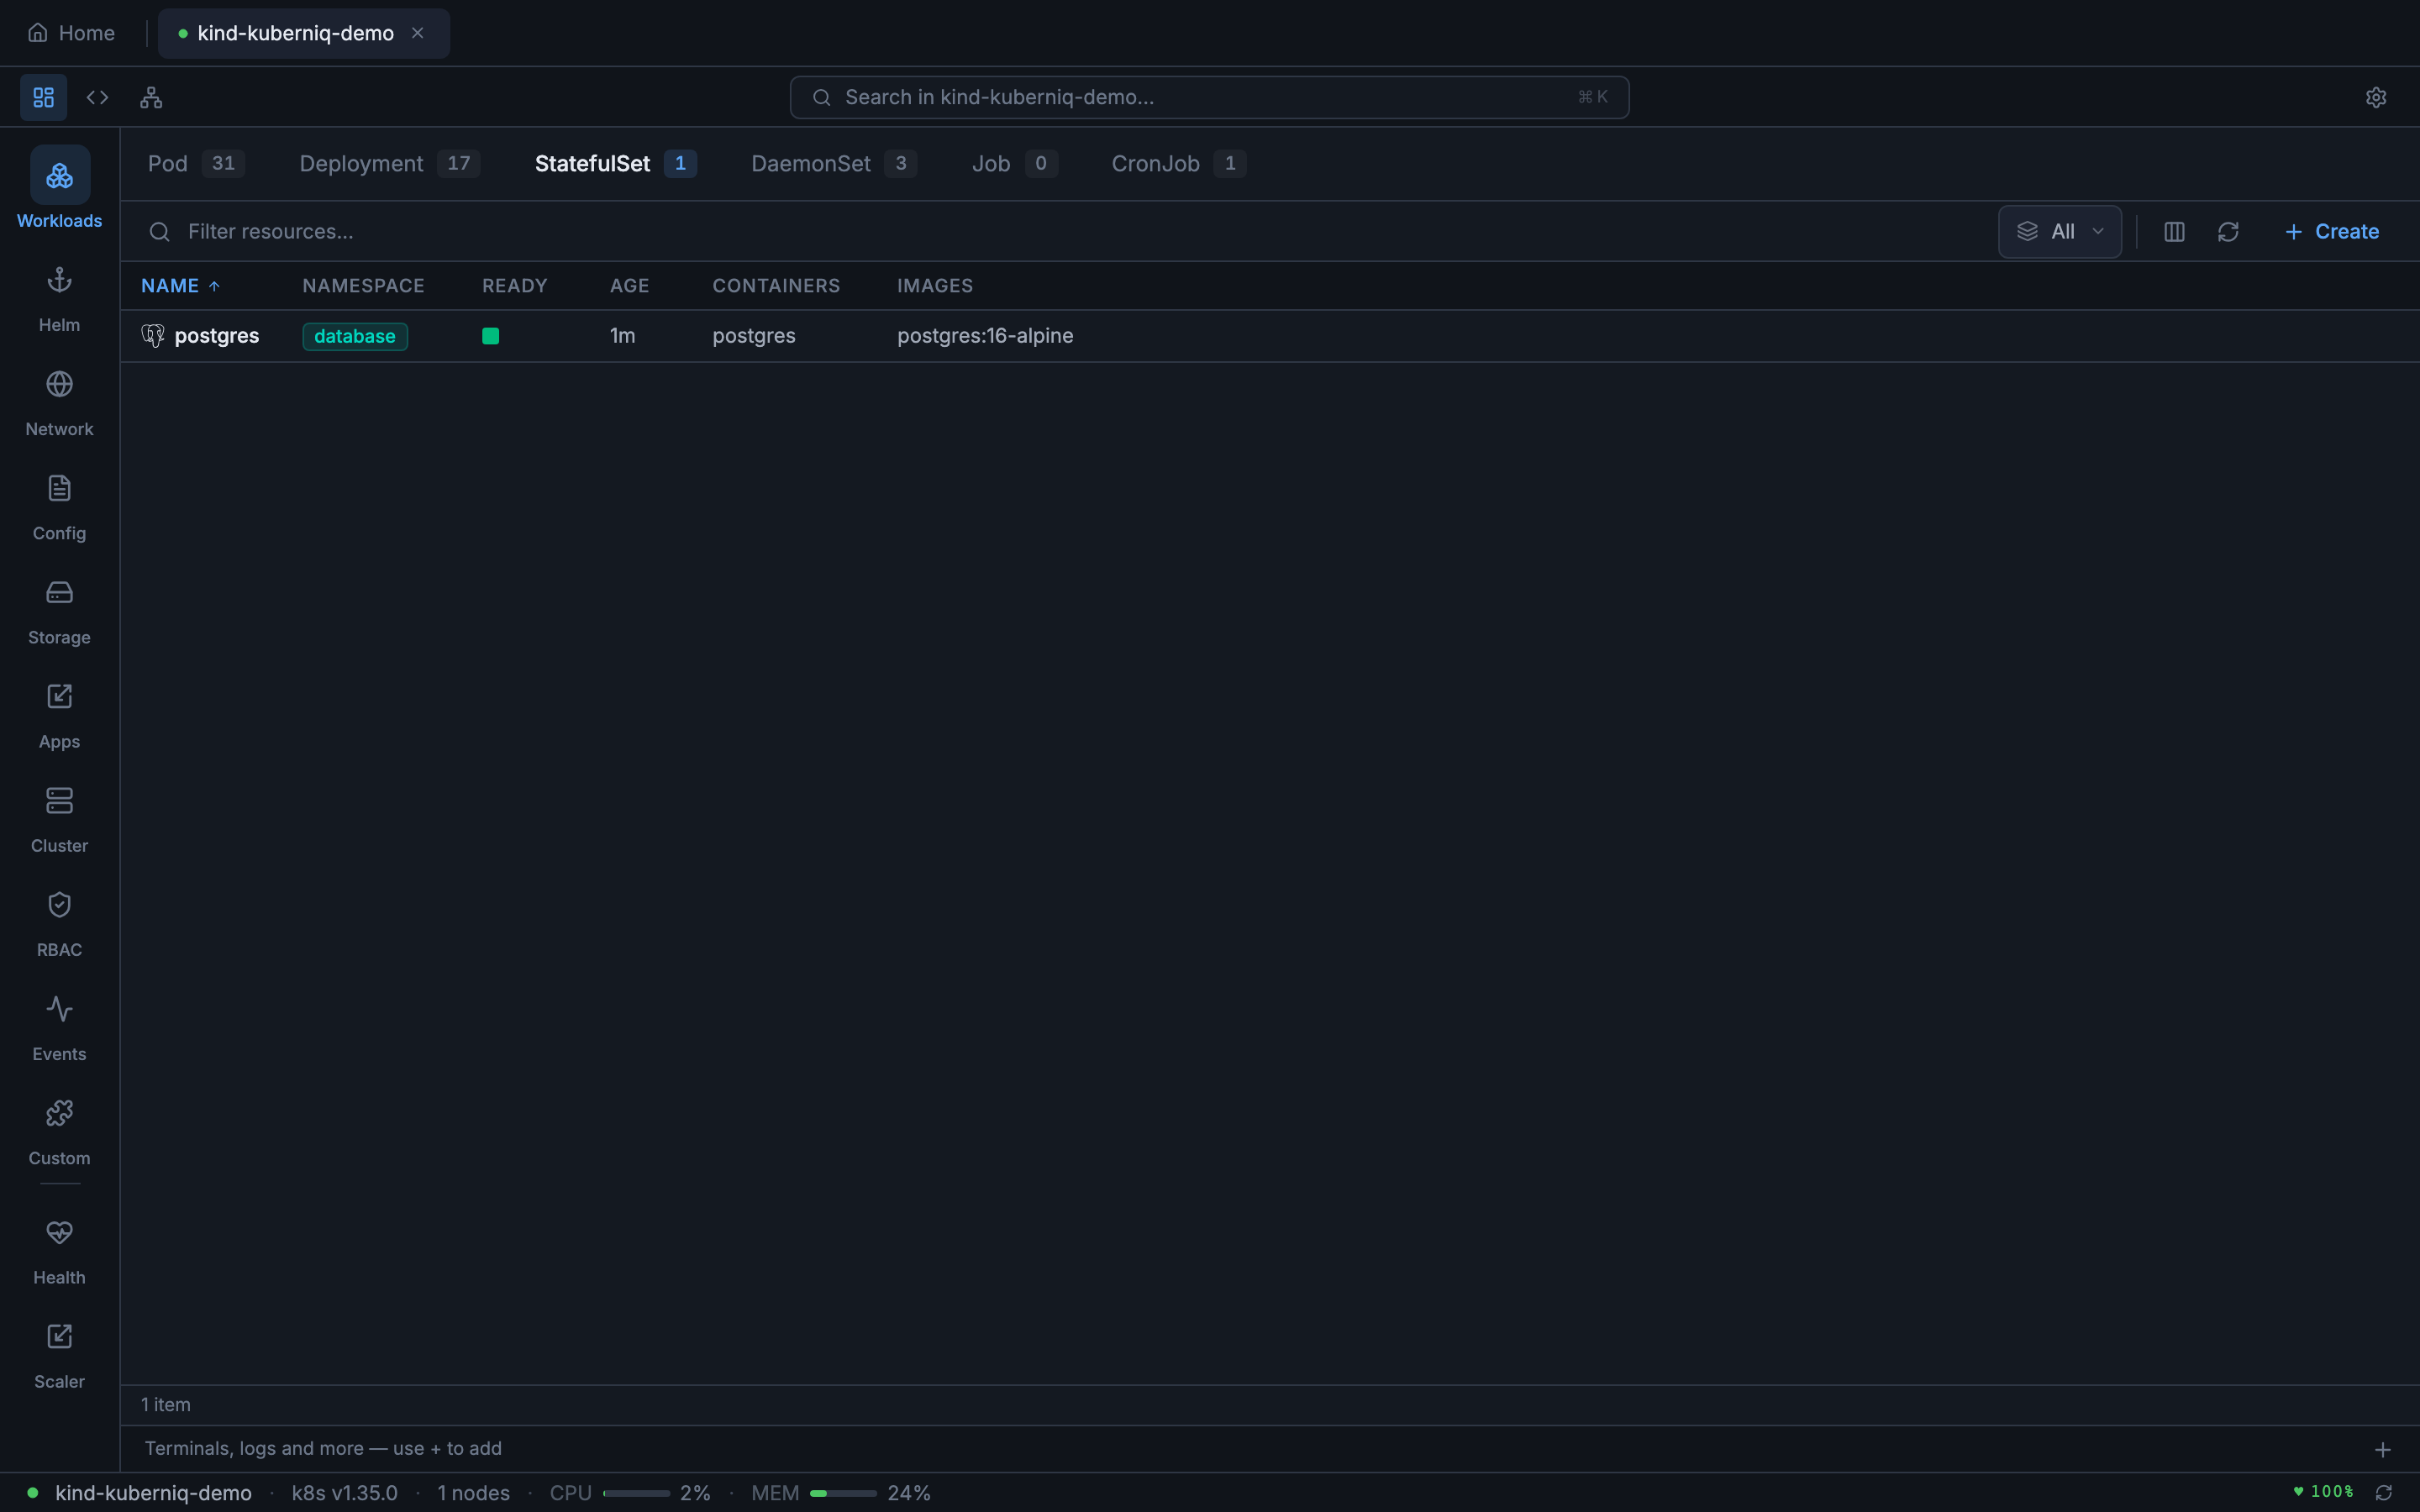
- StatefulSets — Ordered pod management with ready replica tracking
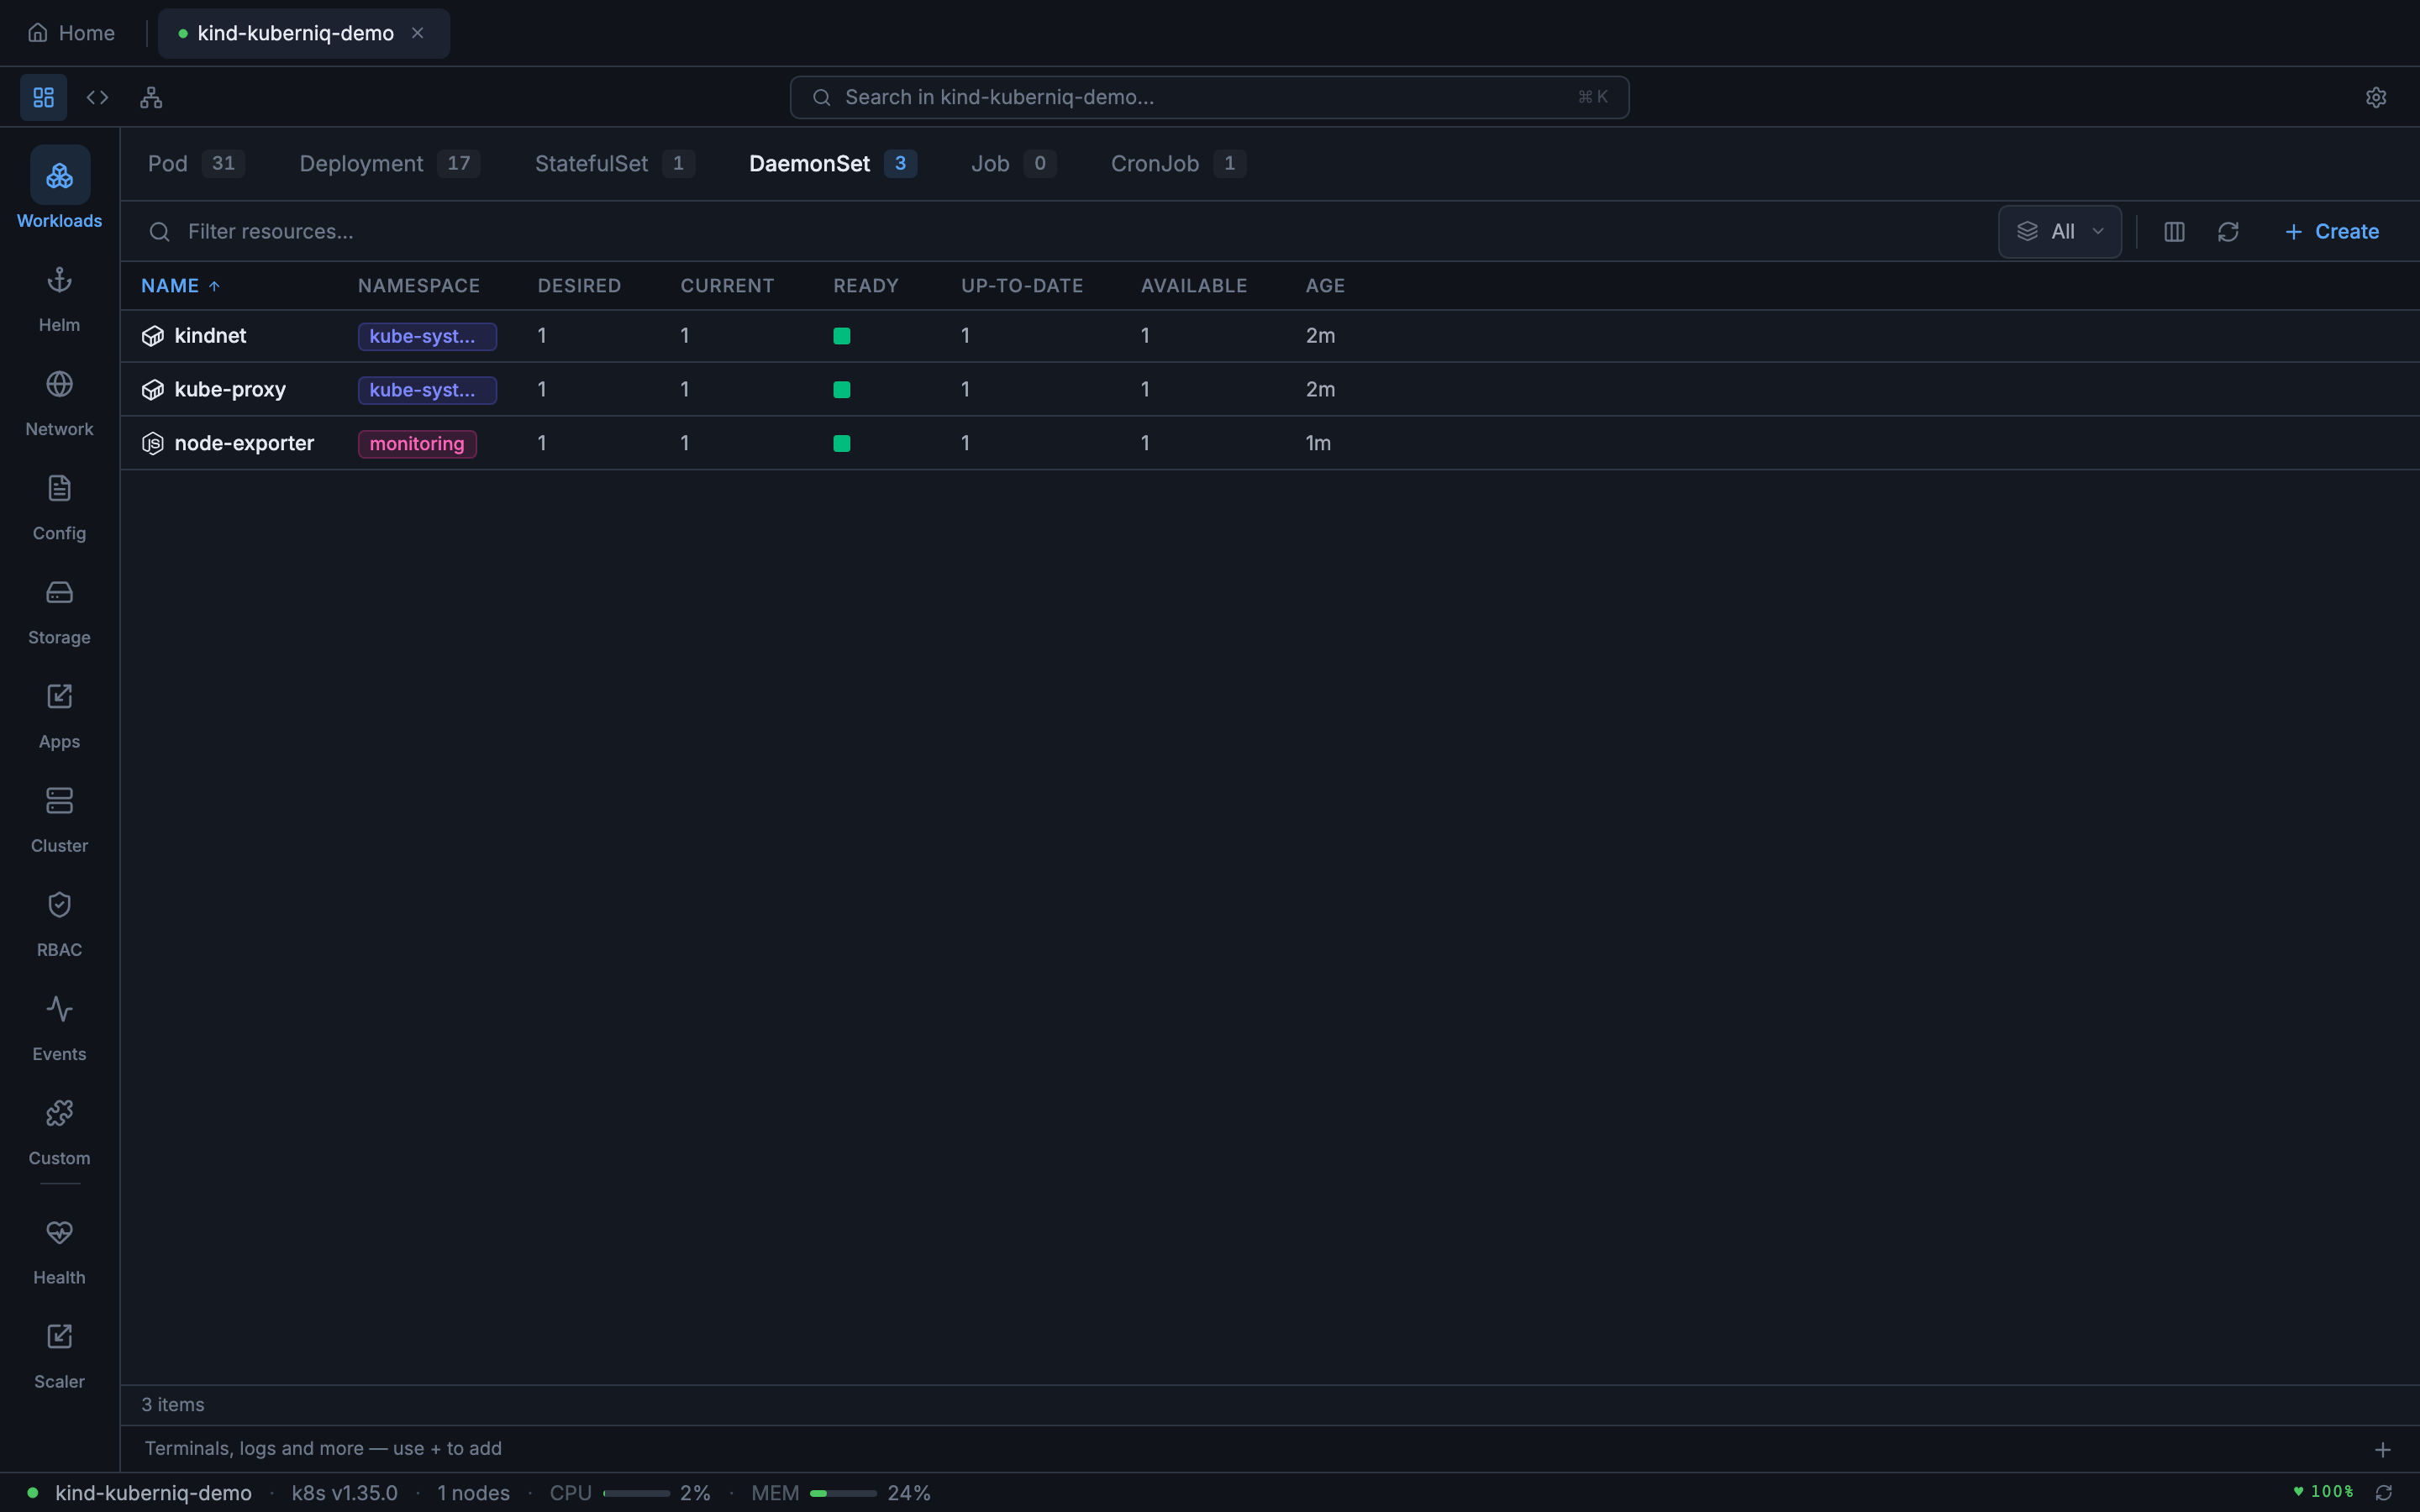
- DaemonSets — Per-node workloads with desired/ready/available counts
- Jobs — One-off tasks with completion status and duration
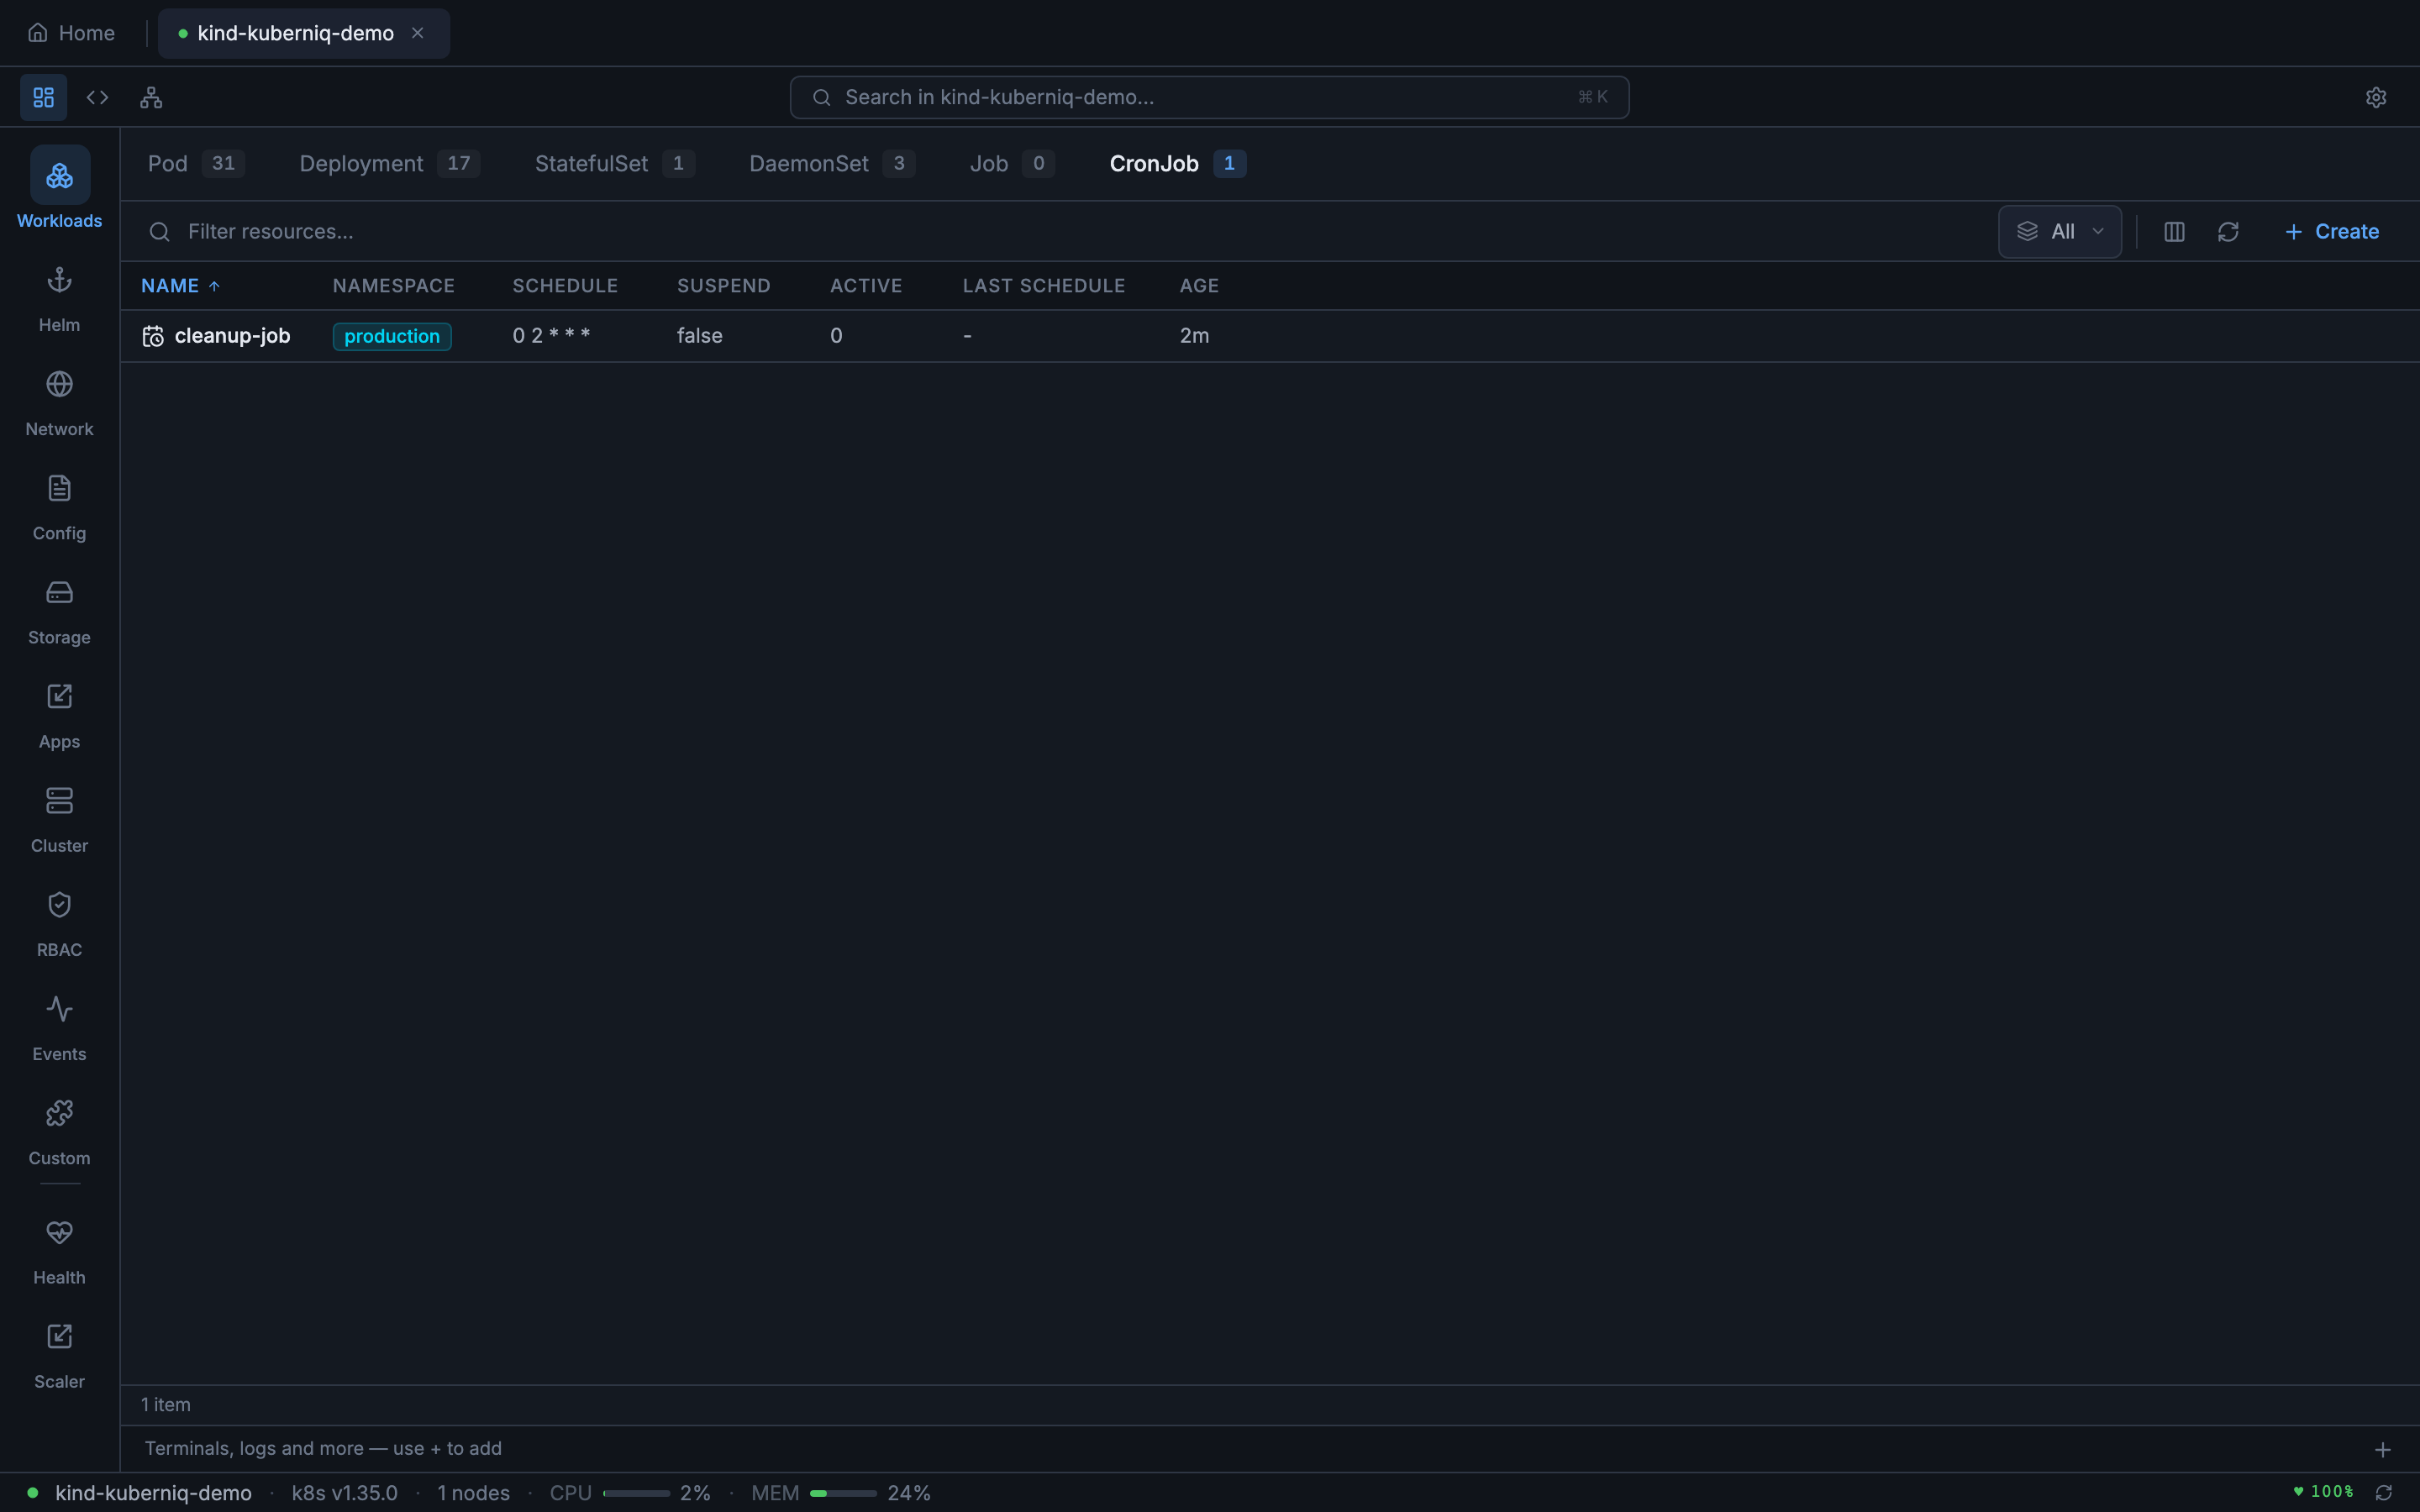
- CronJobs — Scheduled jobs with cron expressions, last schedule time, and suspend state
Helm
- Releases — Installed Helm charts with status, revision, and chart version
- Charts — Browsable chart catalog from configured repositories
Network
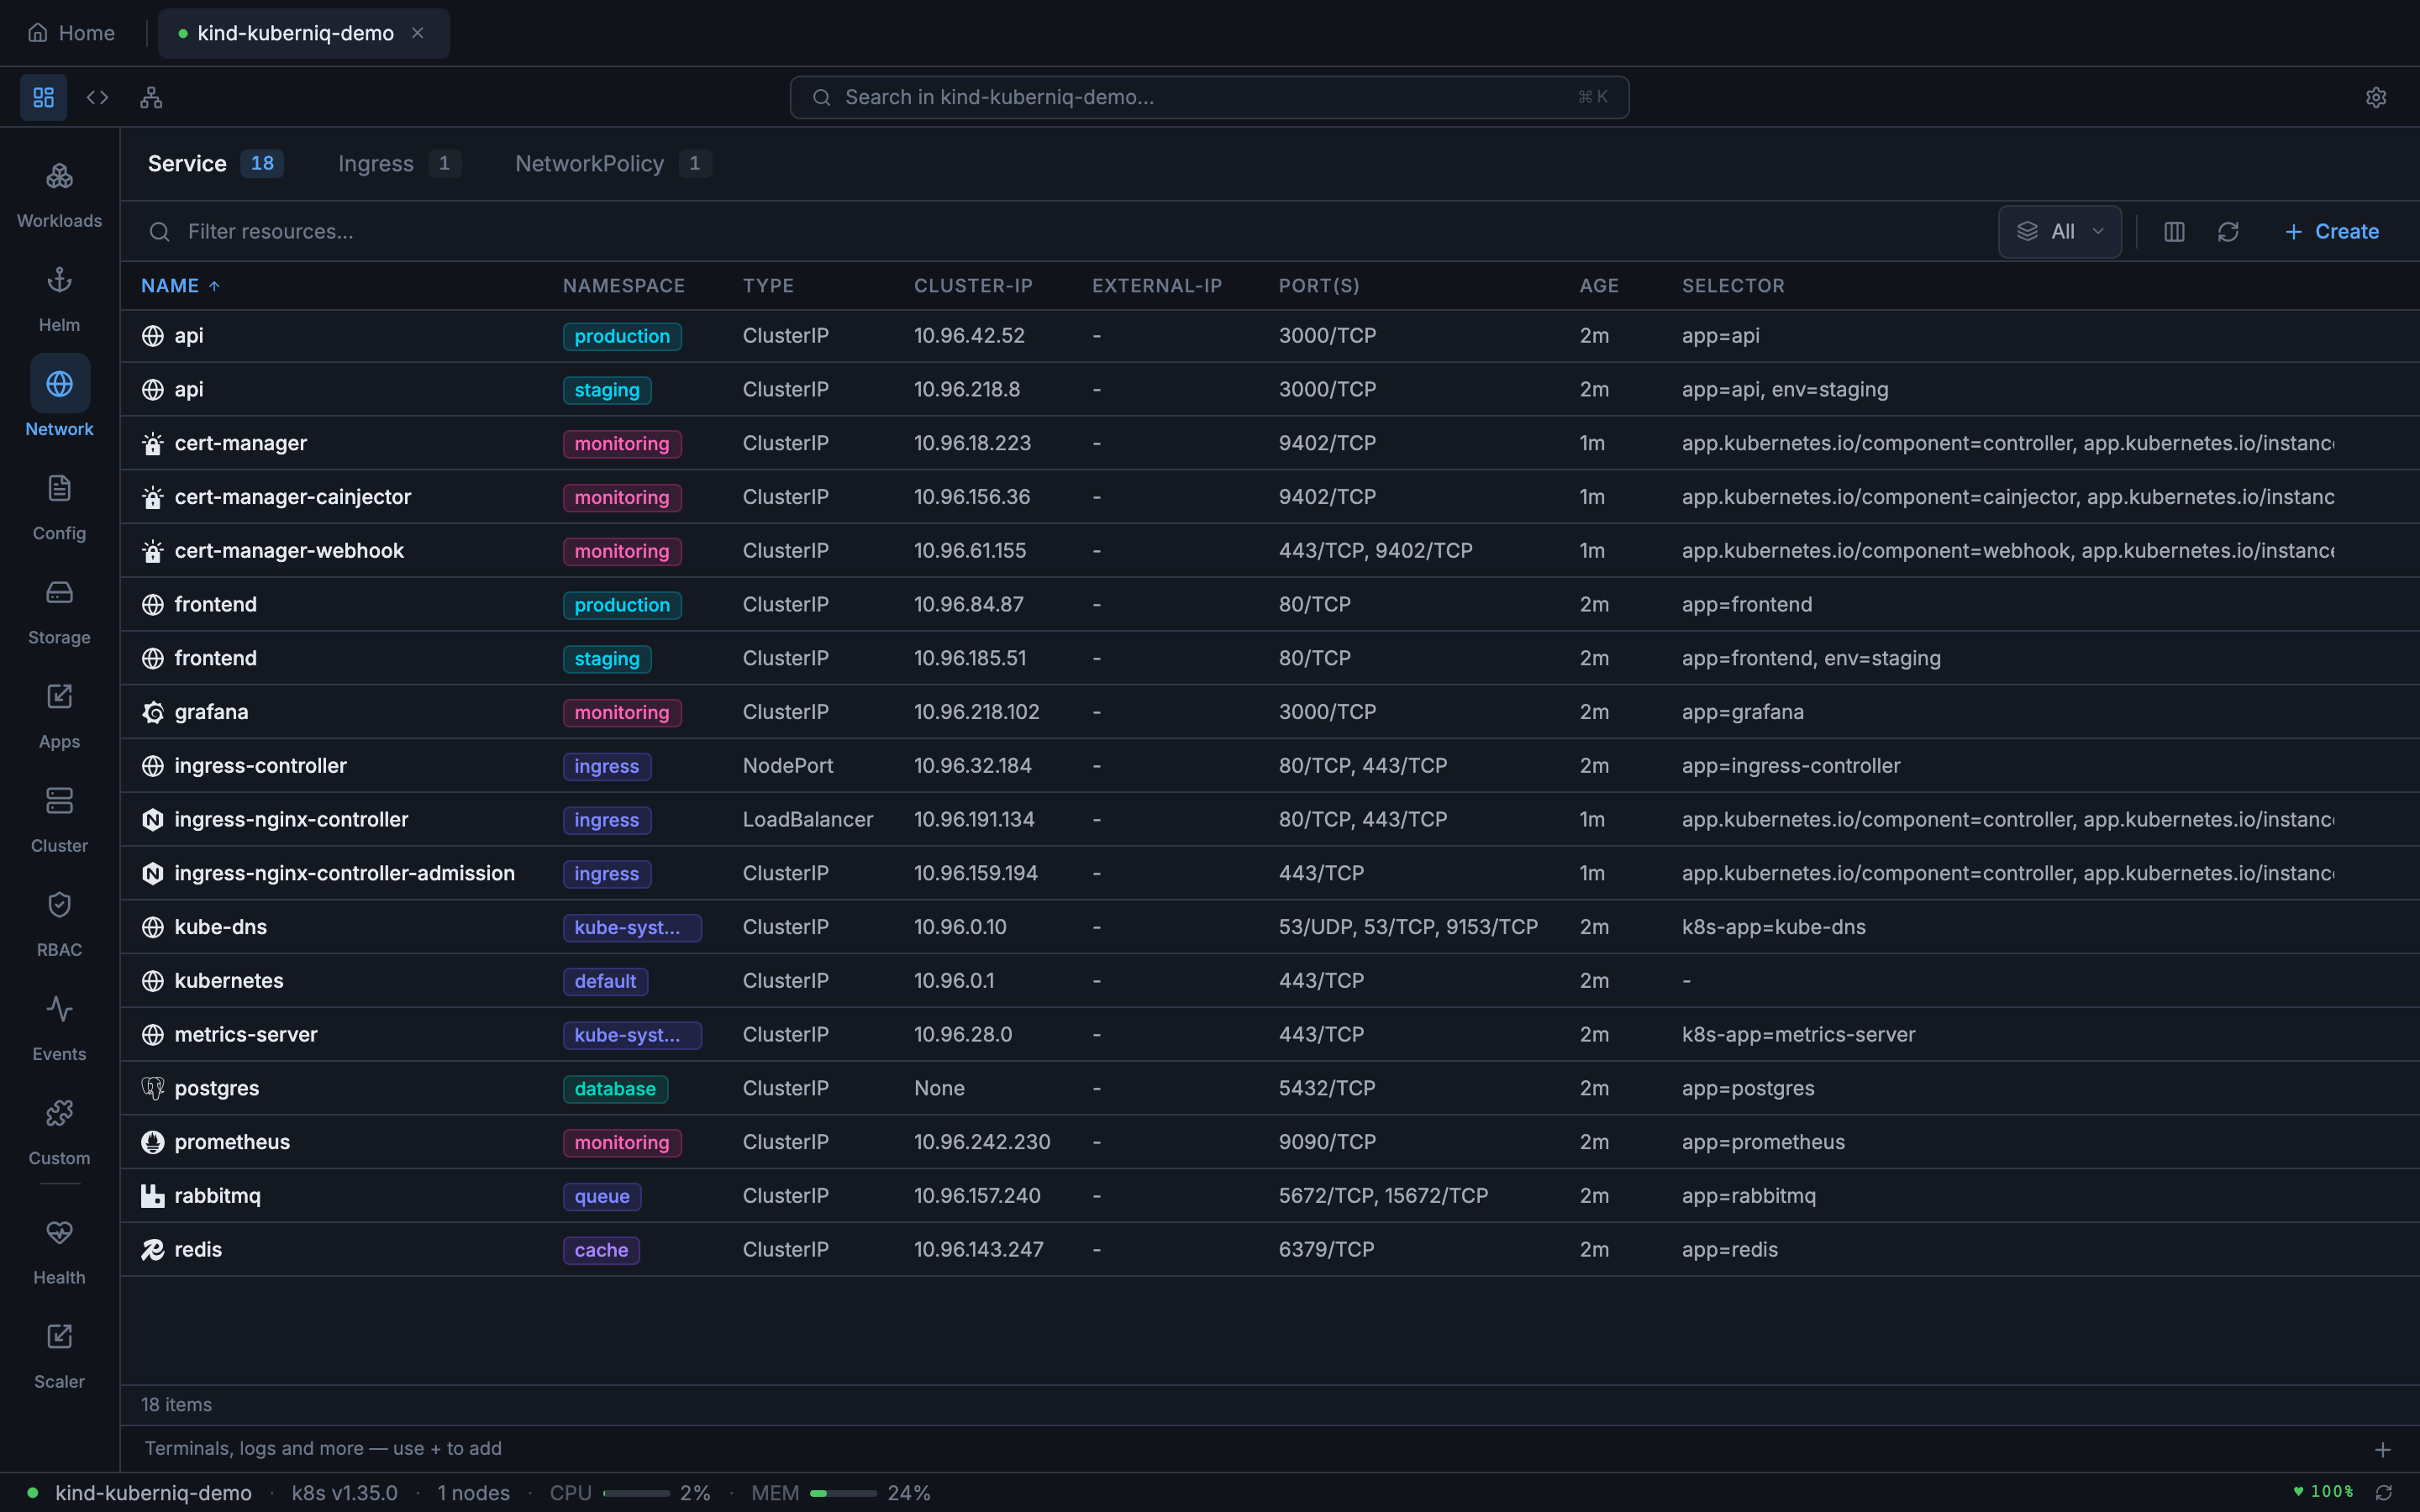
- Services — ClusterIP, NodePort, LoadBalancer, and ExternalName services with port mappings
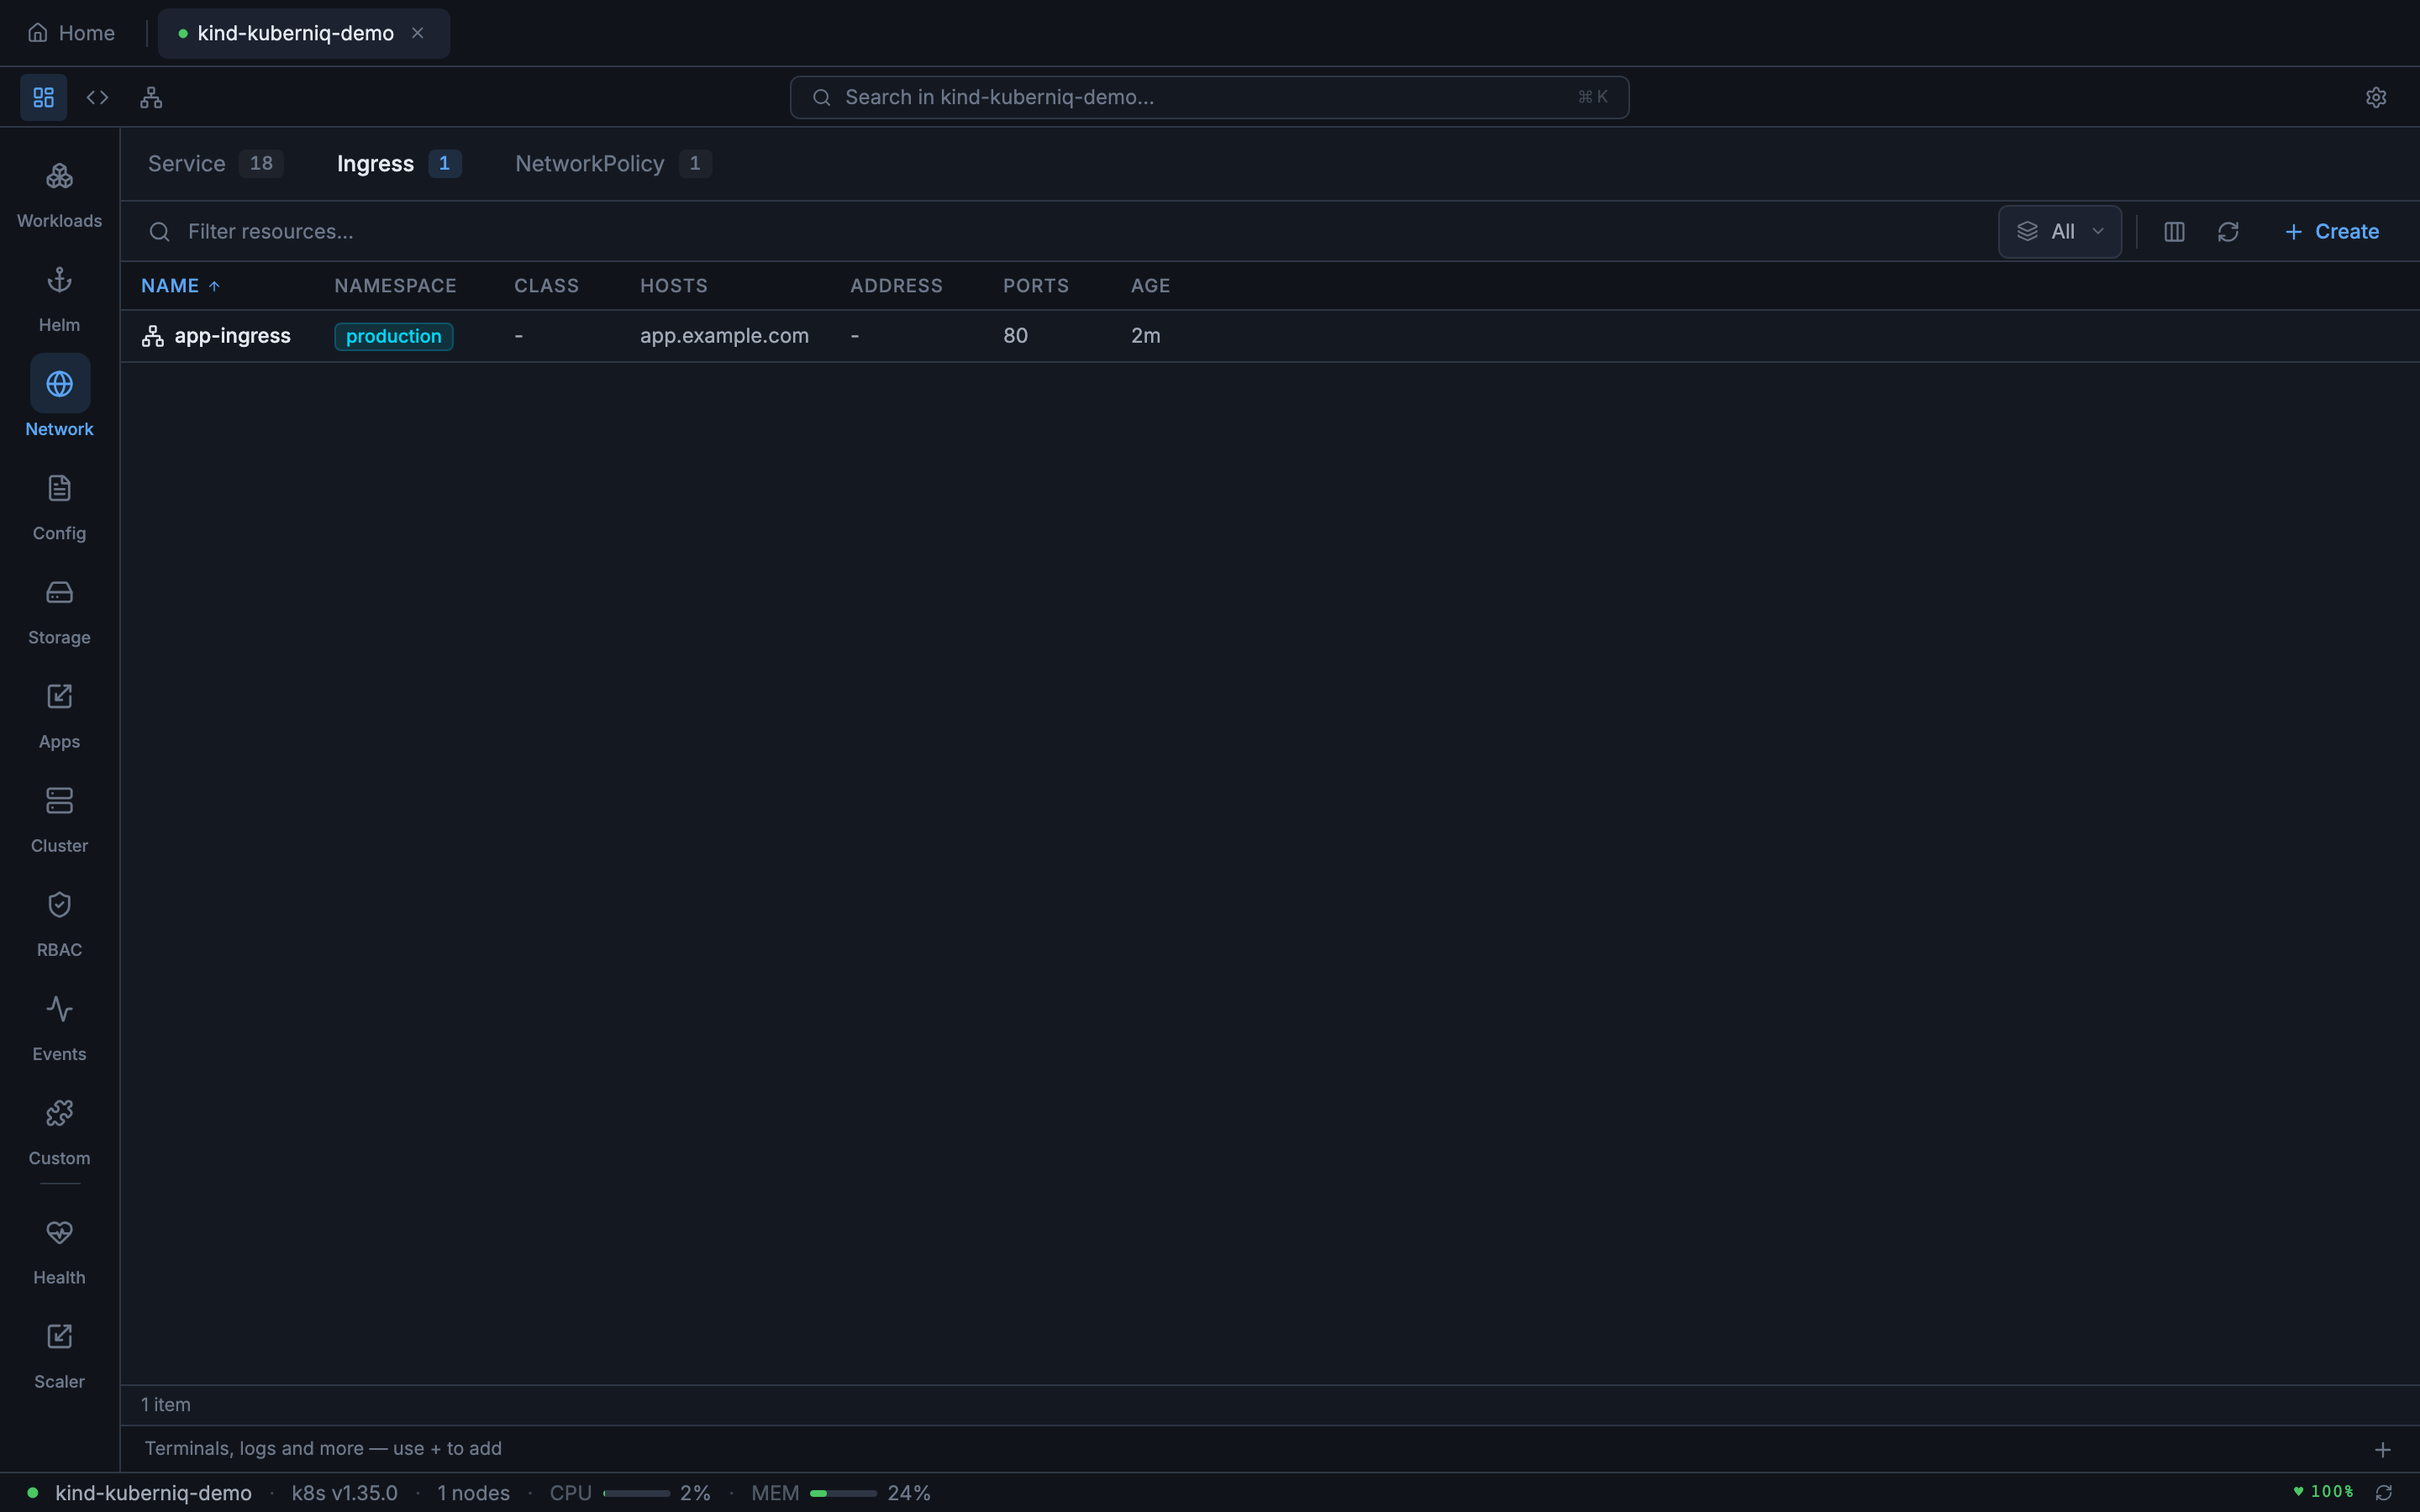
- Ingresses — HTTP routing rules with hosts, paths, and backend references
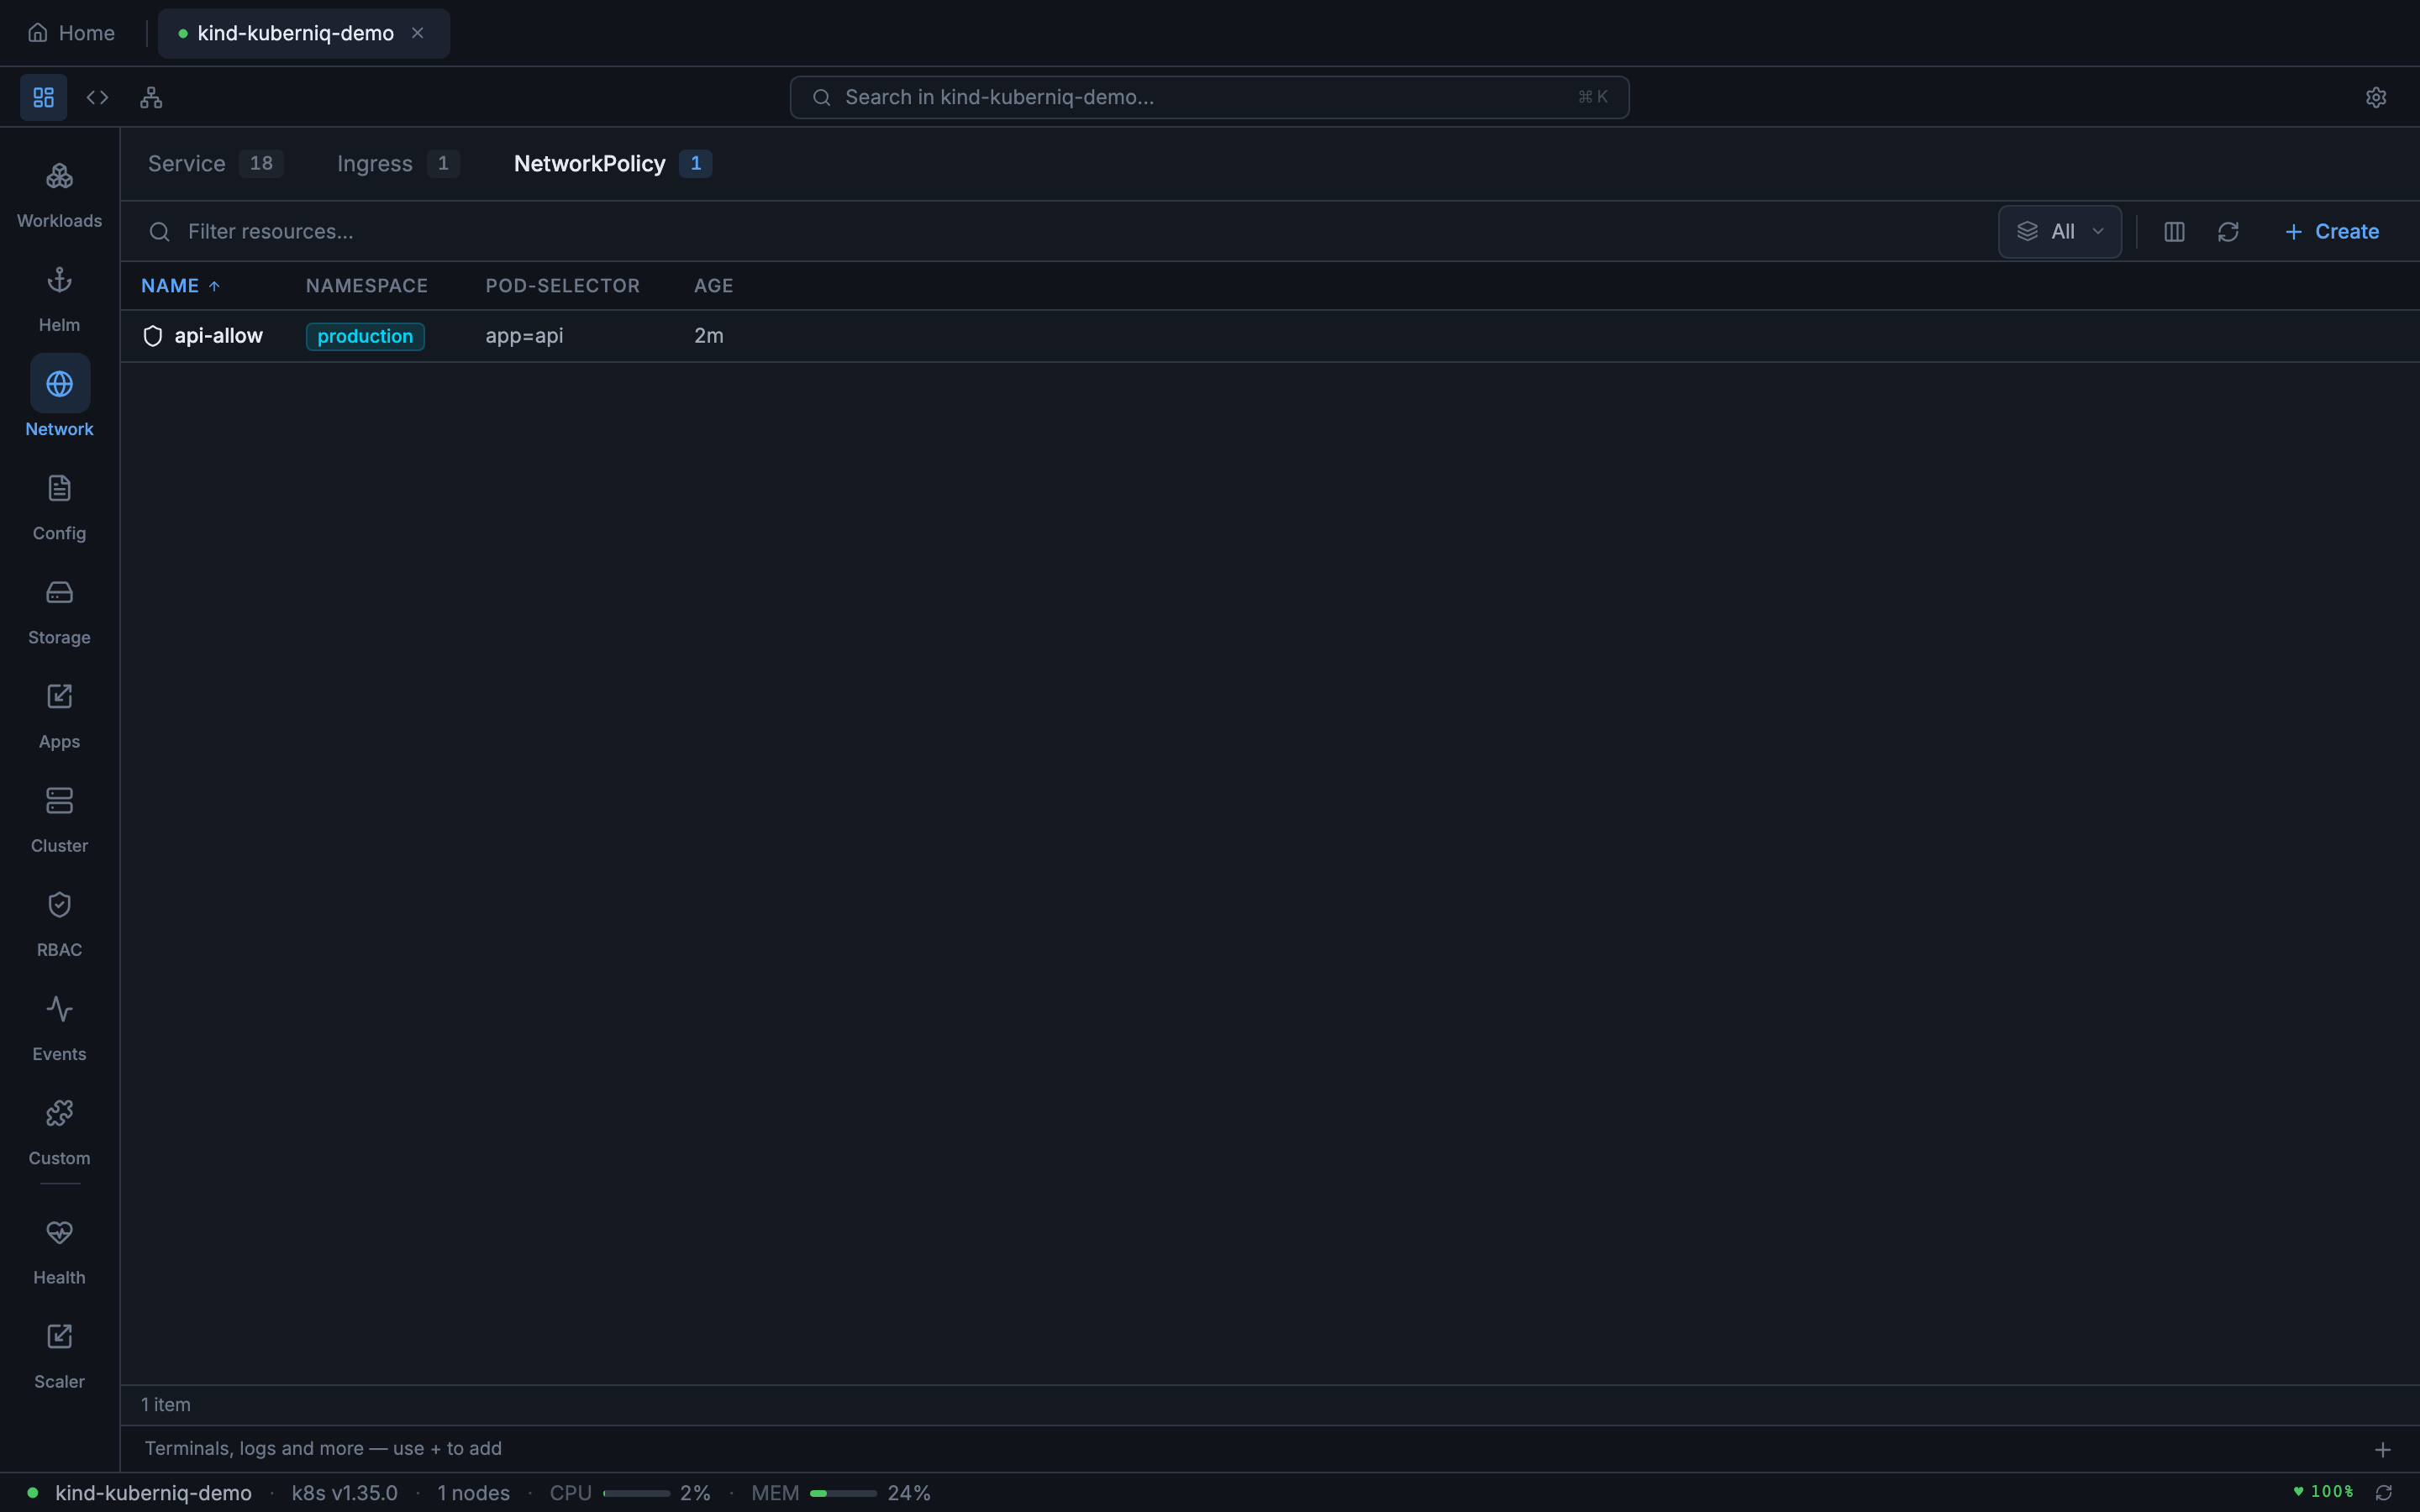
- NetworkPolicies — Pod-level network access control rules
Config
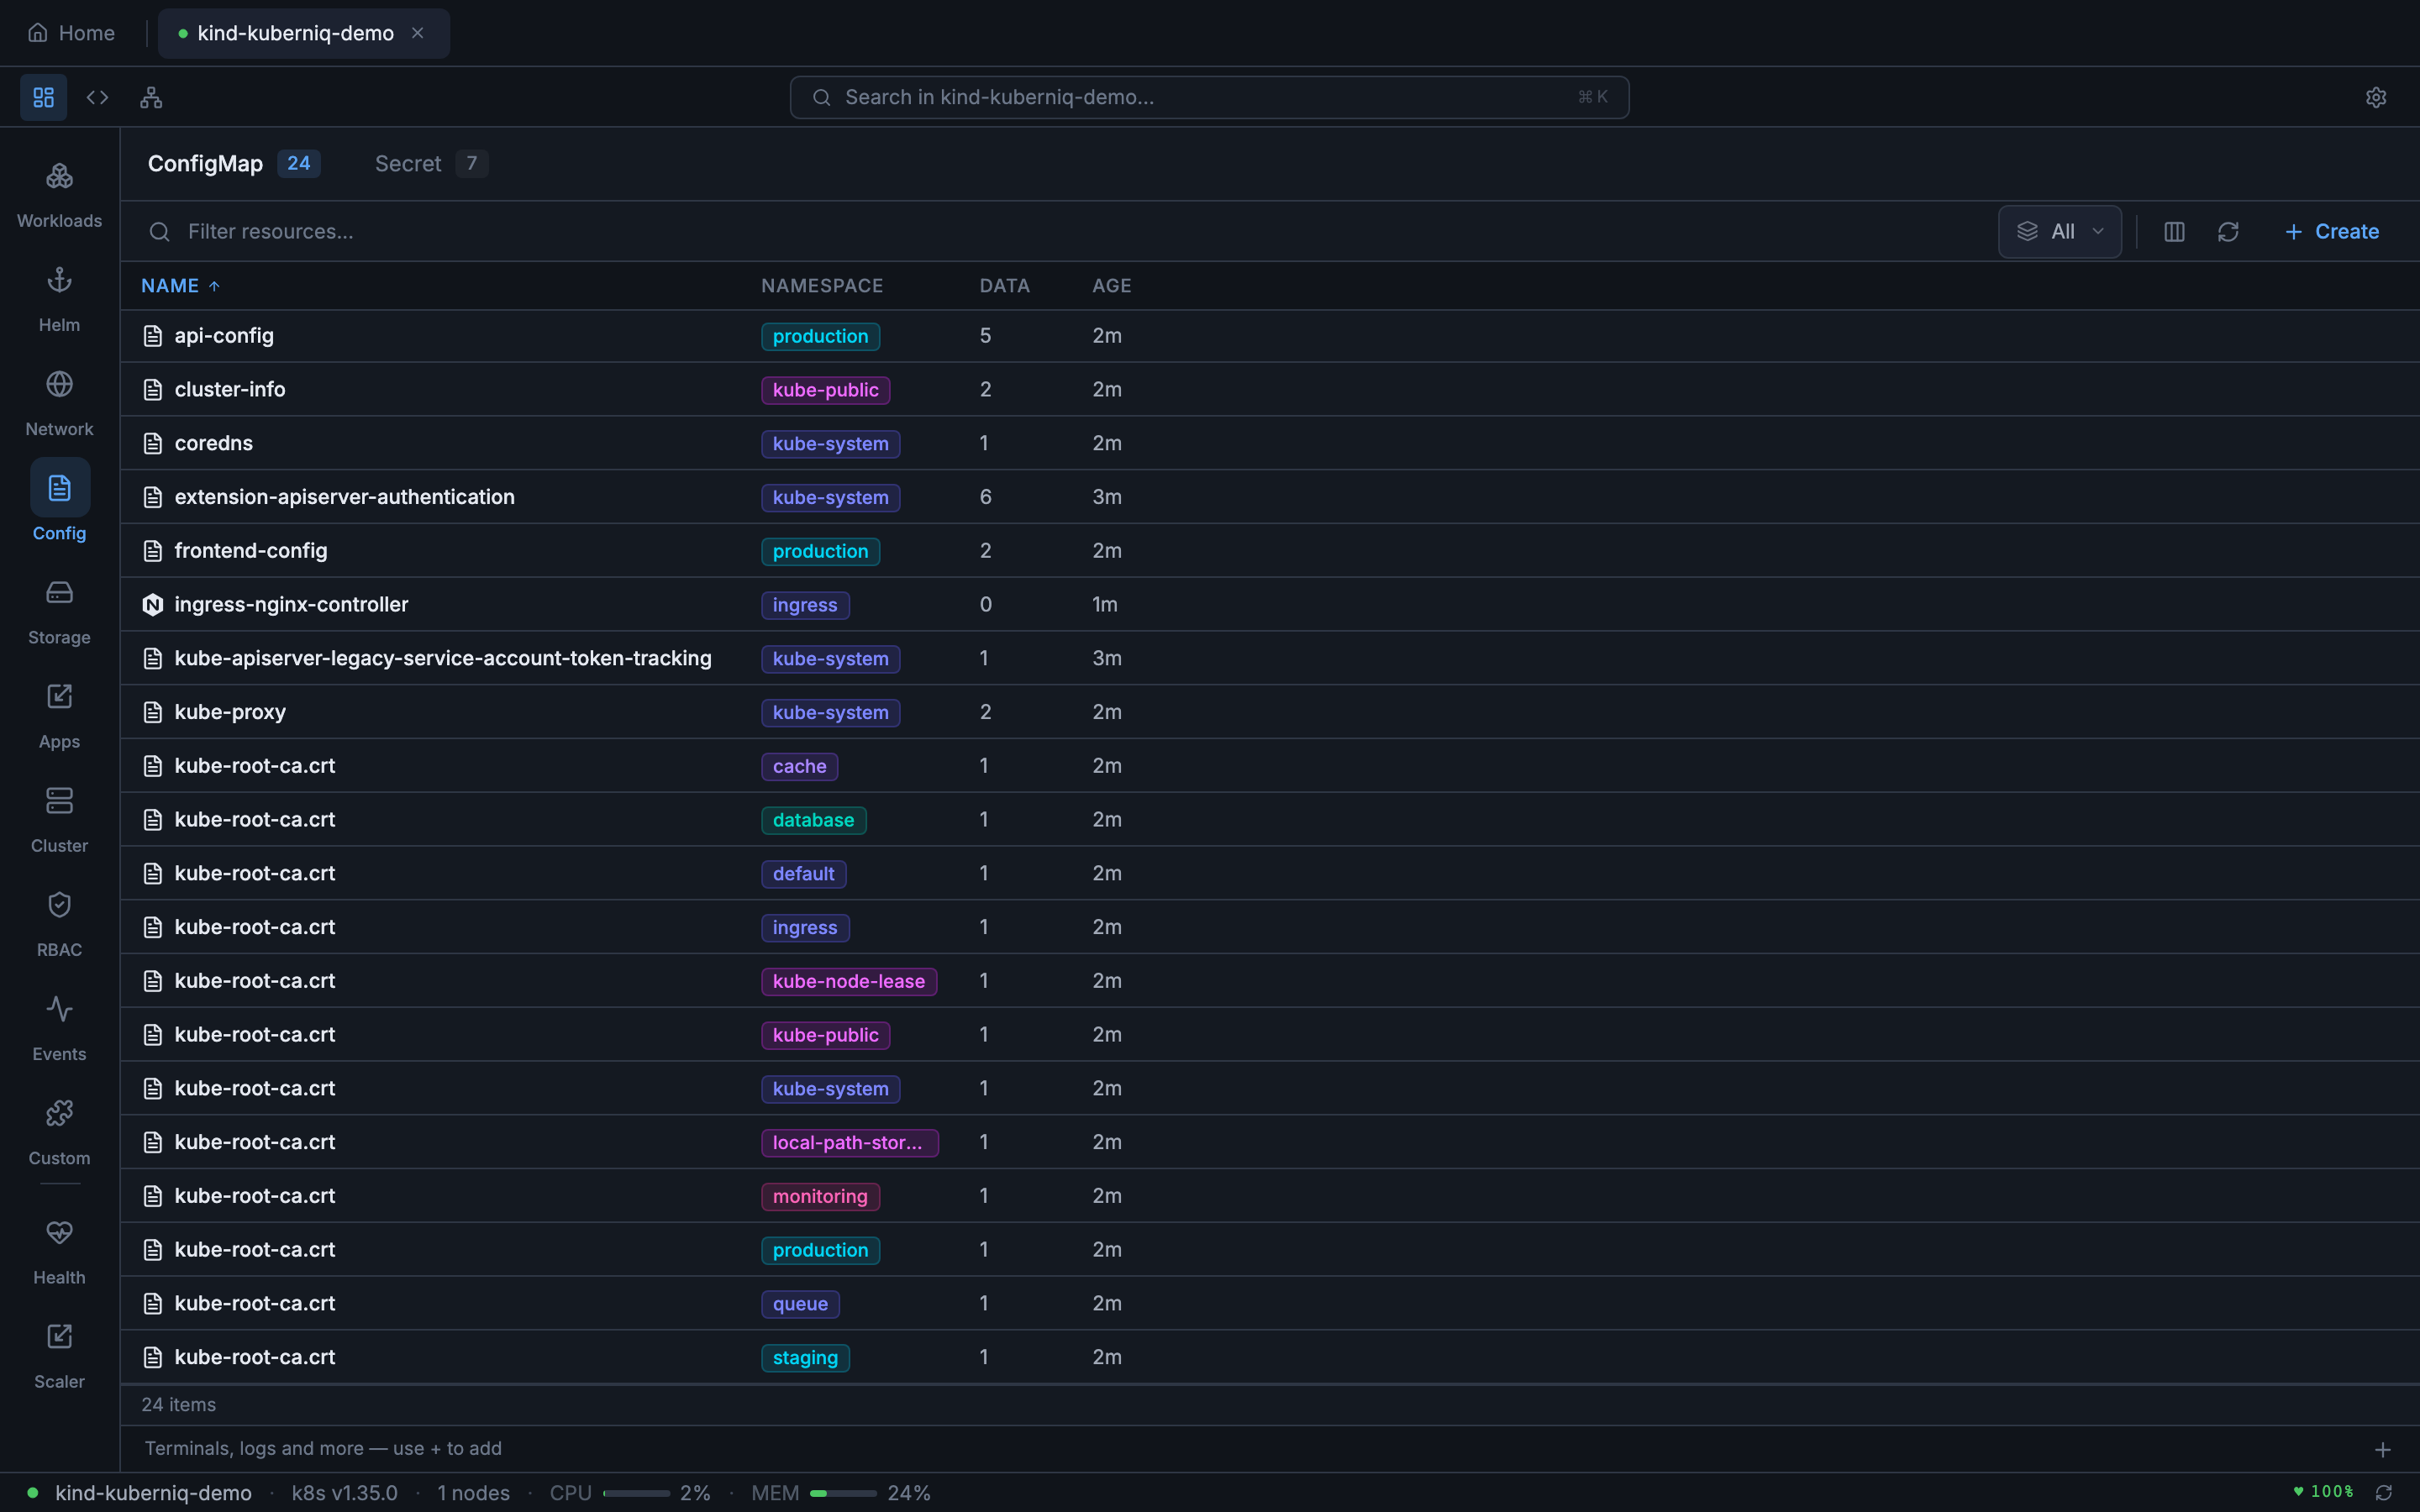
- ConfigMaps — Key-value configuration data with data key count
- Secrets — Encoded secret data with type classification (Opaque, TLS, docker-registry, etc.)
Storage
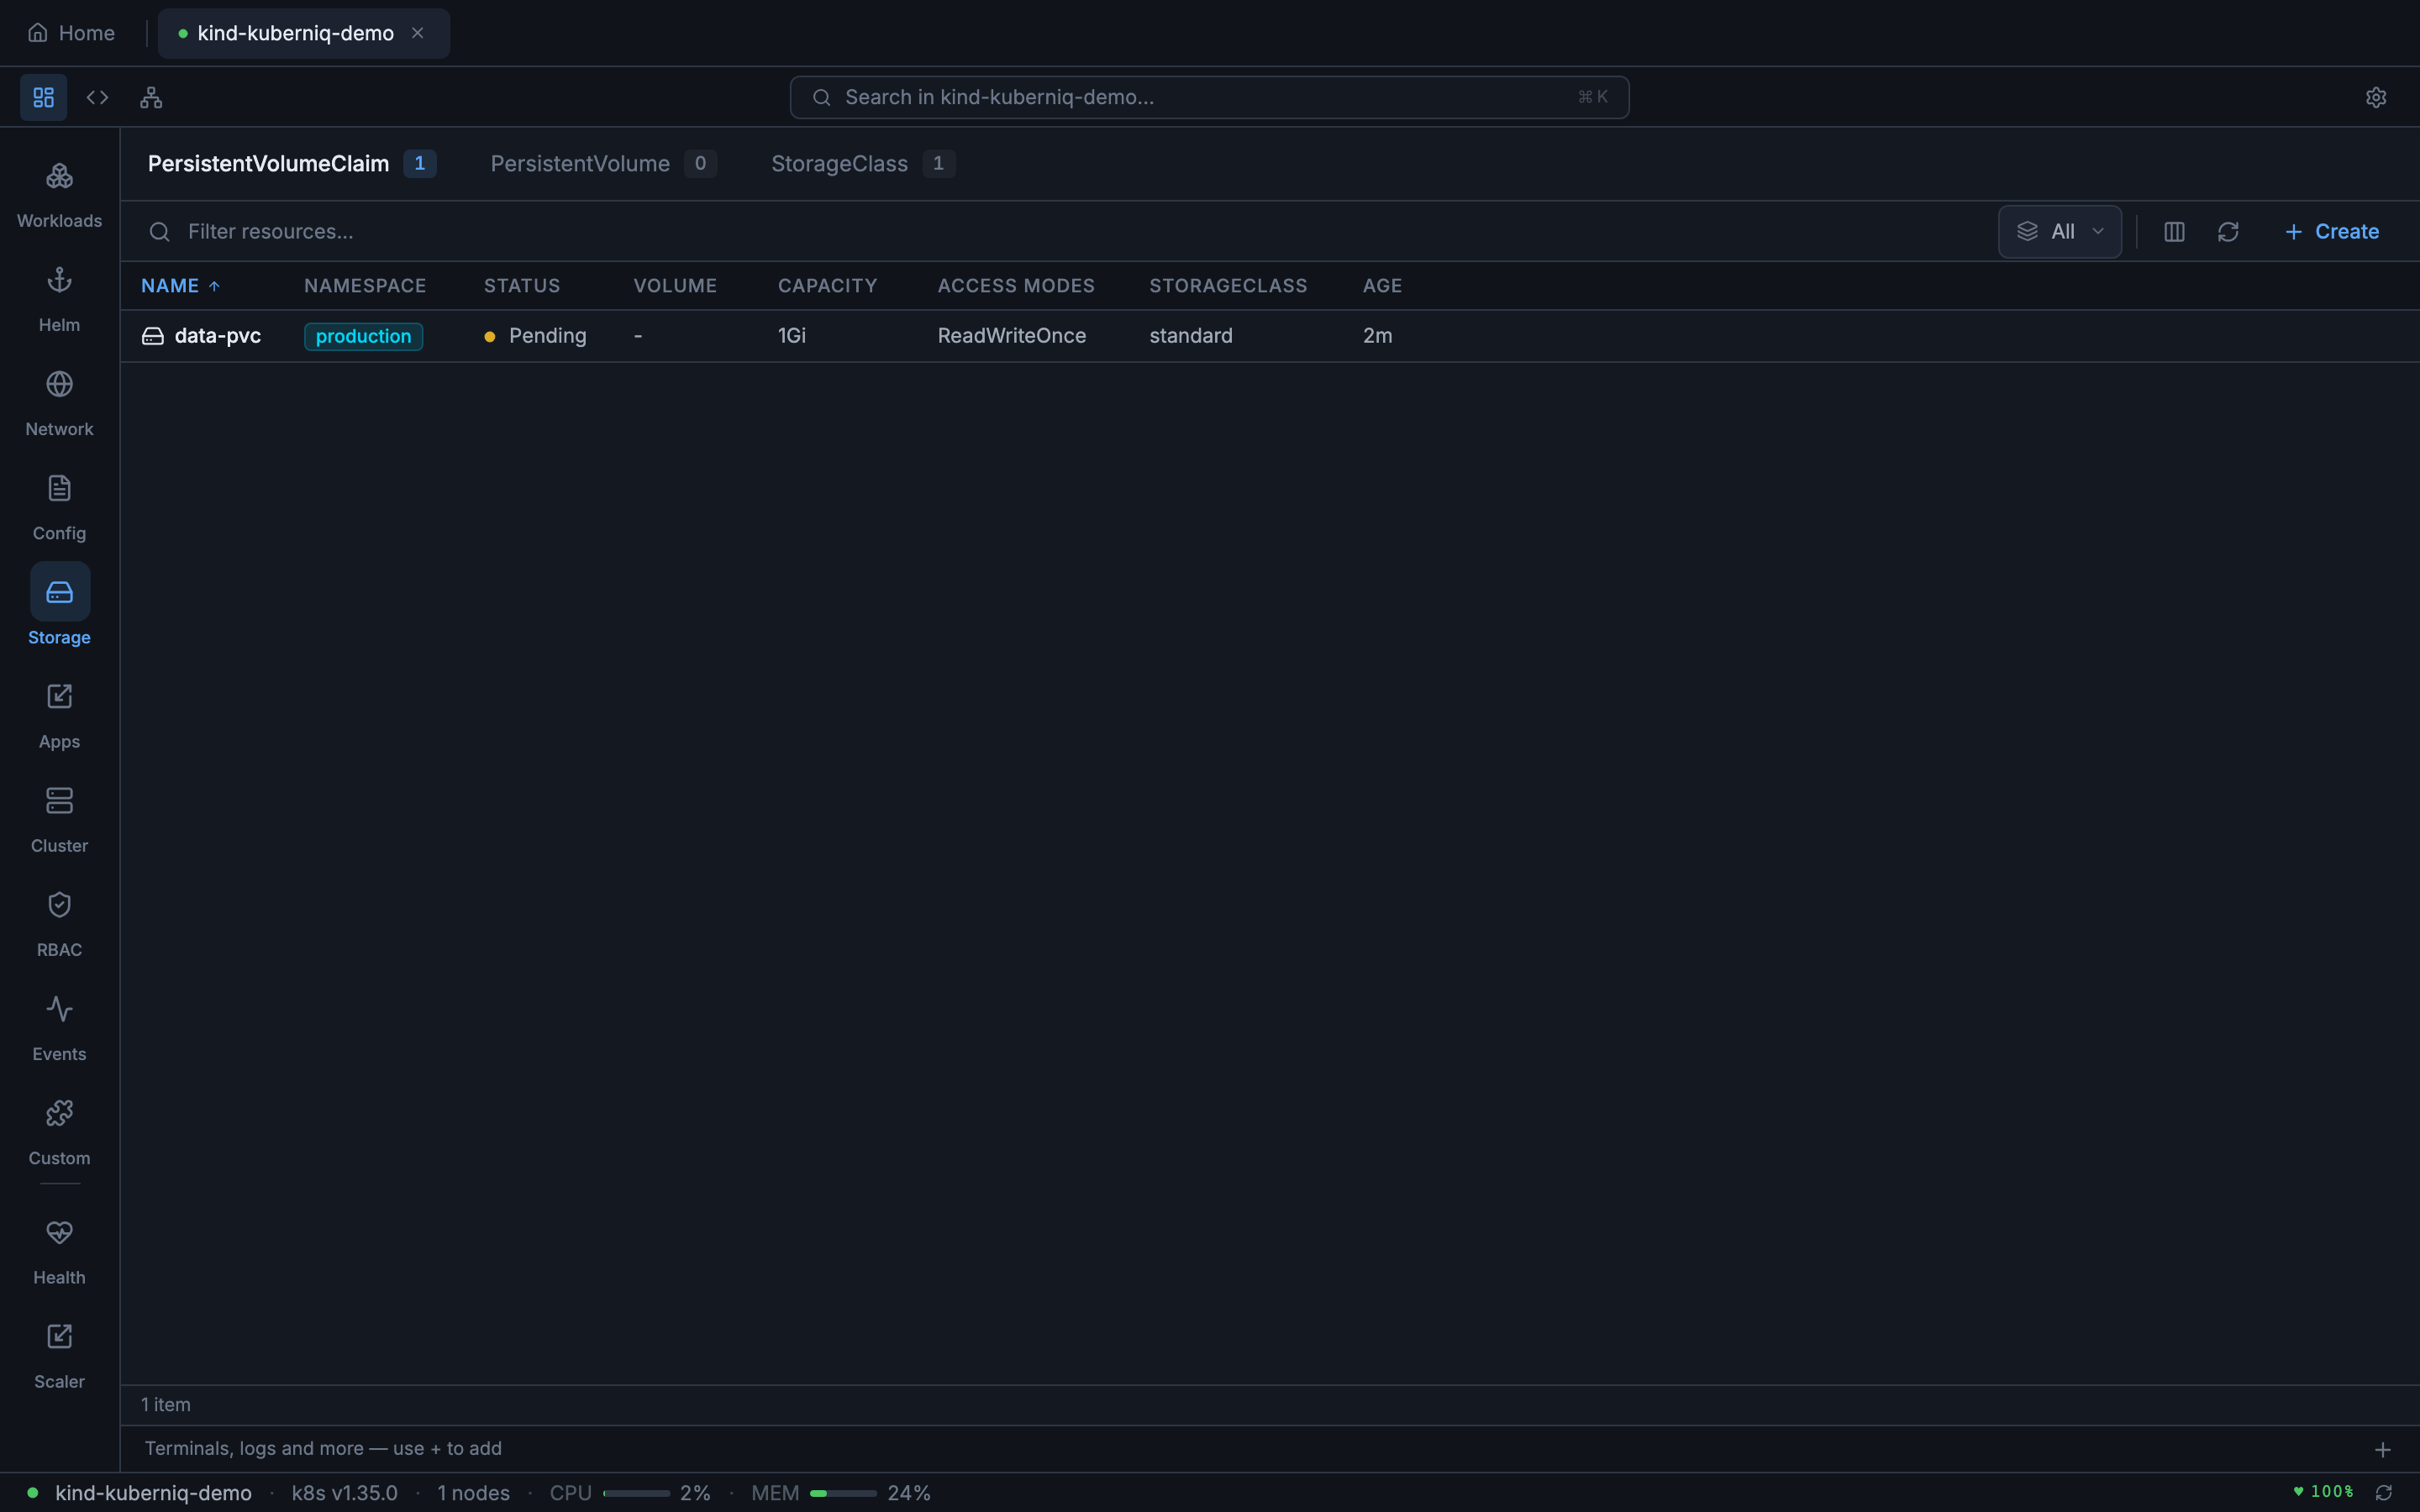
- PersistentVolumeClaims — Storage requests with status, capacity, access modes, and storage class
- PersistentVolumes — Cluster-level storage with reclaim policy and claim reference
- StorageClasses — Storage provisioners with parameters and reclaim policies
Apps
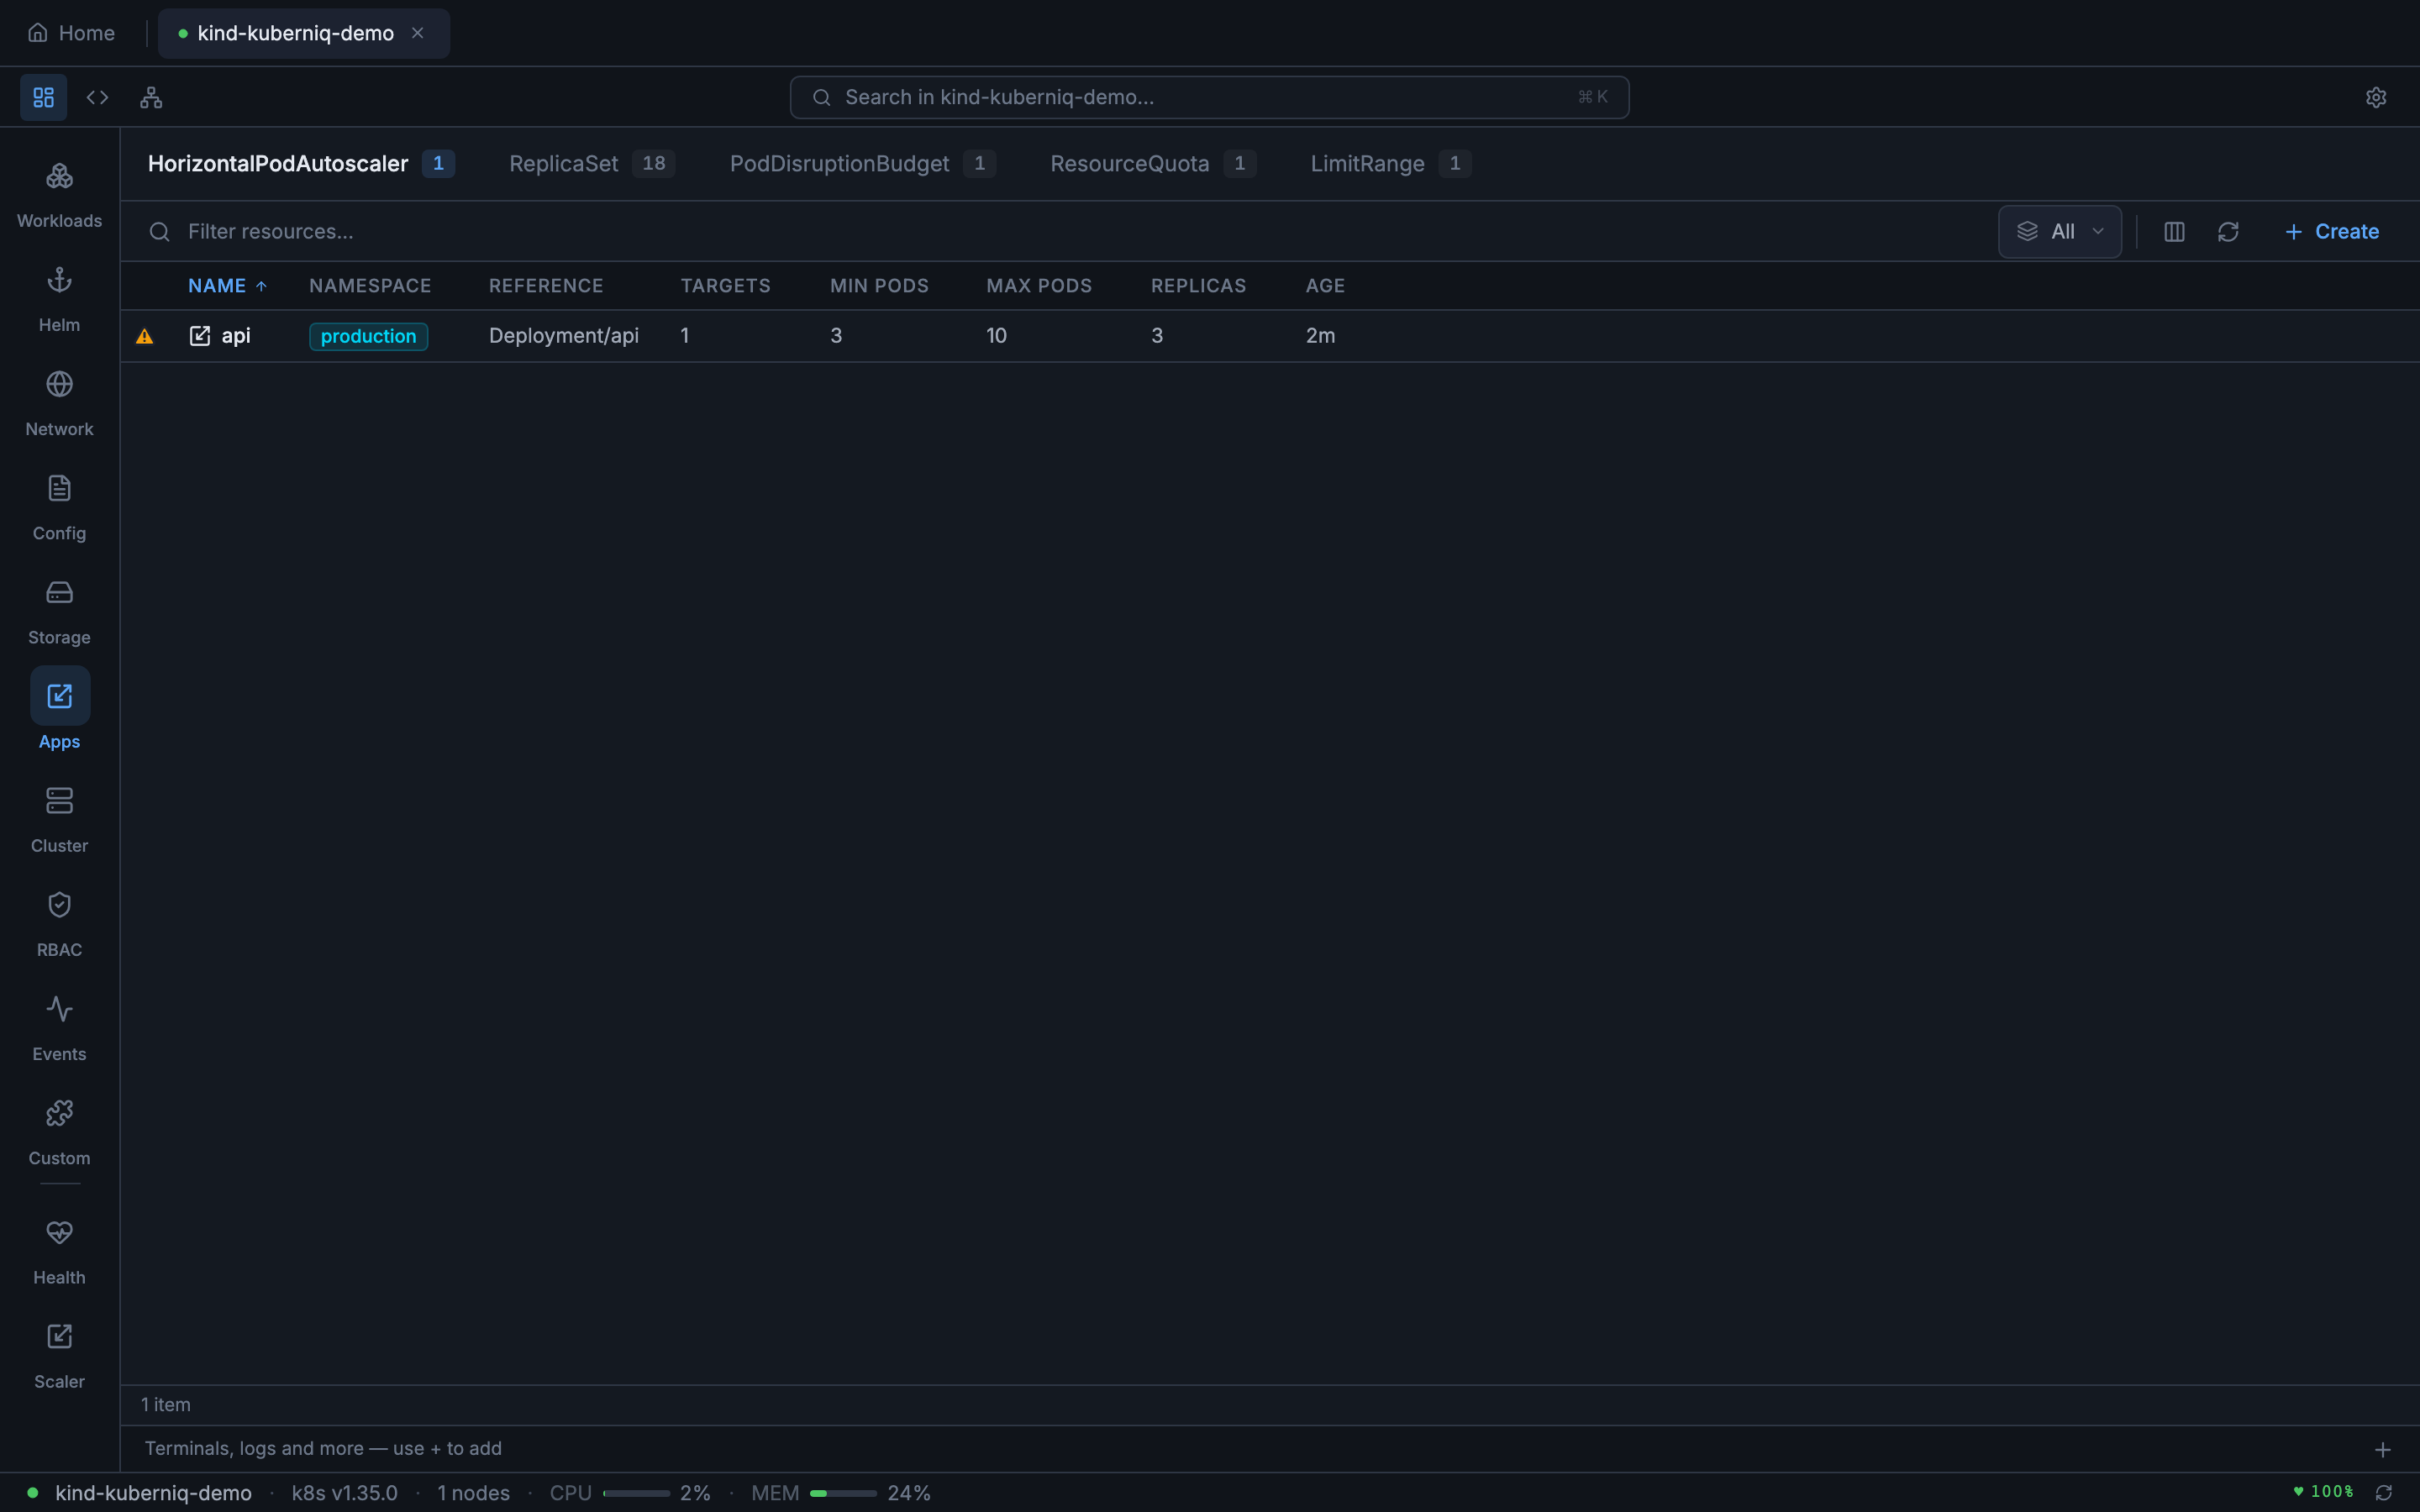
- HorizontalPodAutoscalers — Autoscaling rules with current/target metrics and replica ranges
- ReplicaSets — Low-level replica management (typically managed by Deployments)
- PodDisruptionBudgets — Disruption policies with allowed disruptions and min-available counts
- ResourceQuotas — Namespace-level resource limits with used/hard values
- LimitRanges — Default resource constraints for containers in a namespace
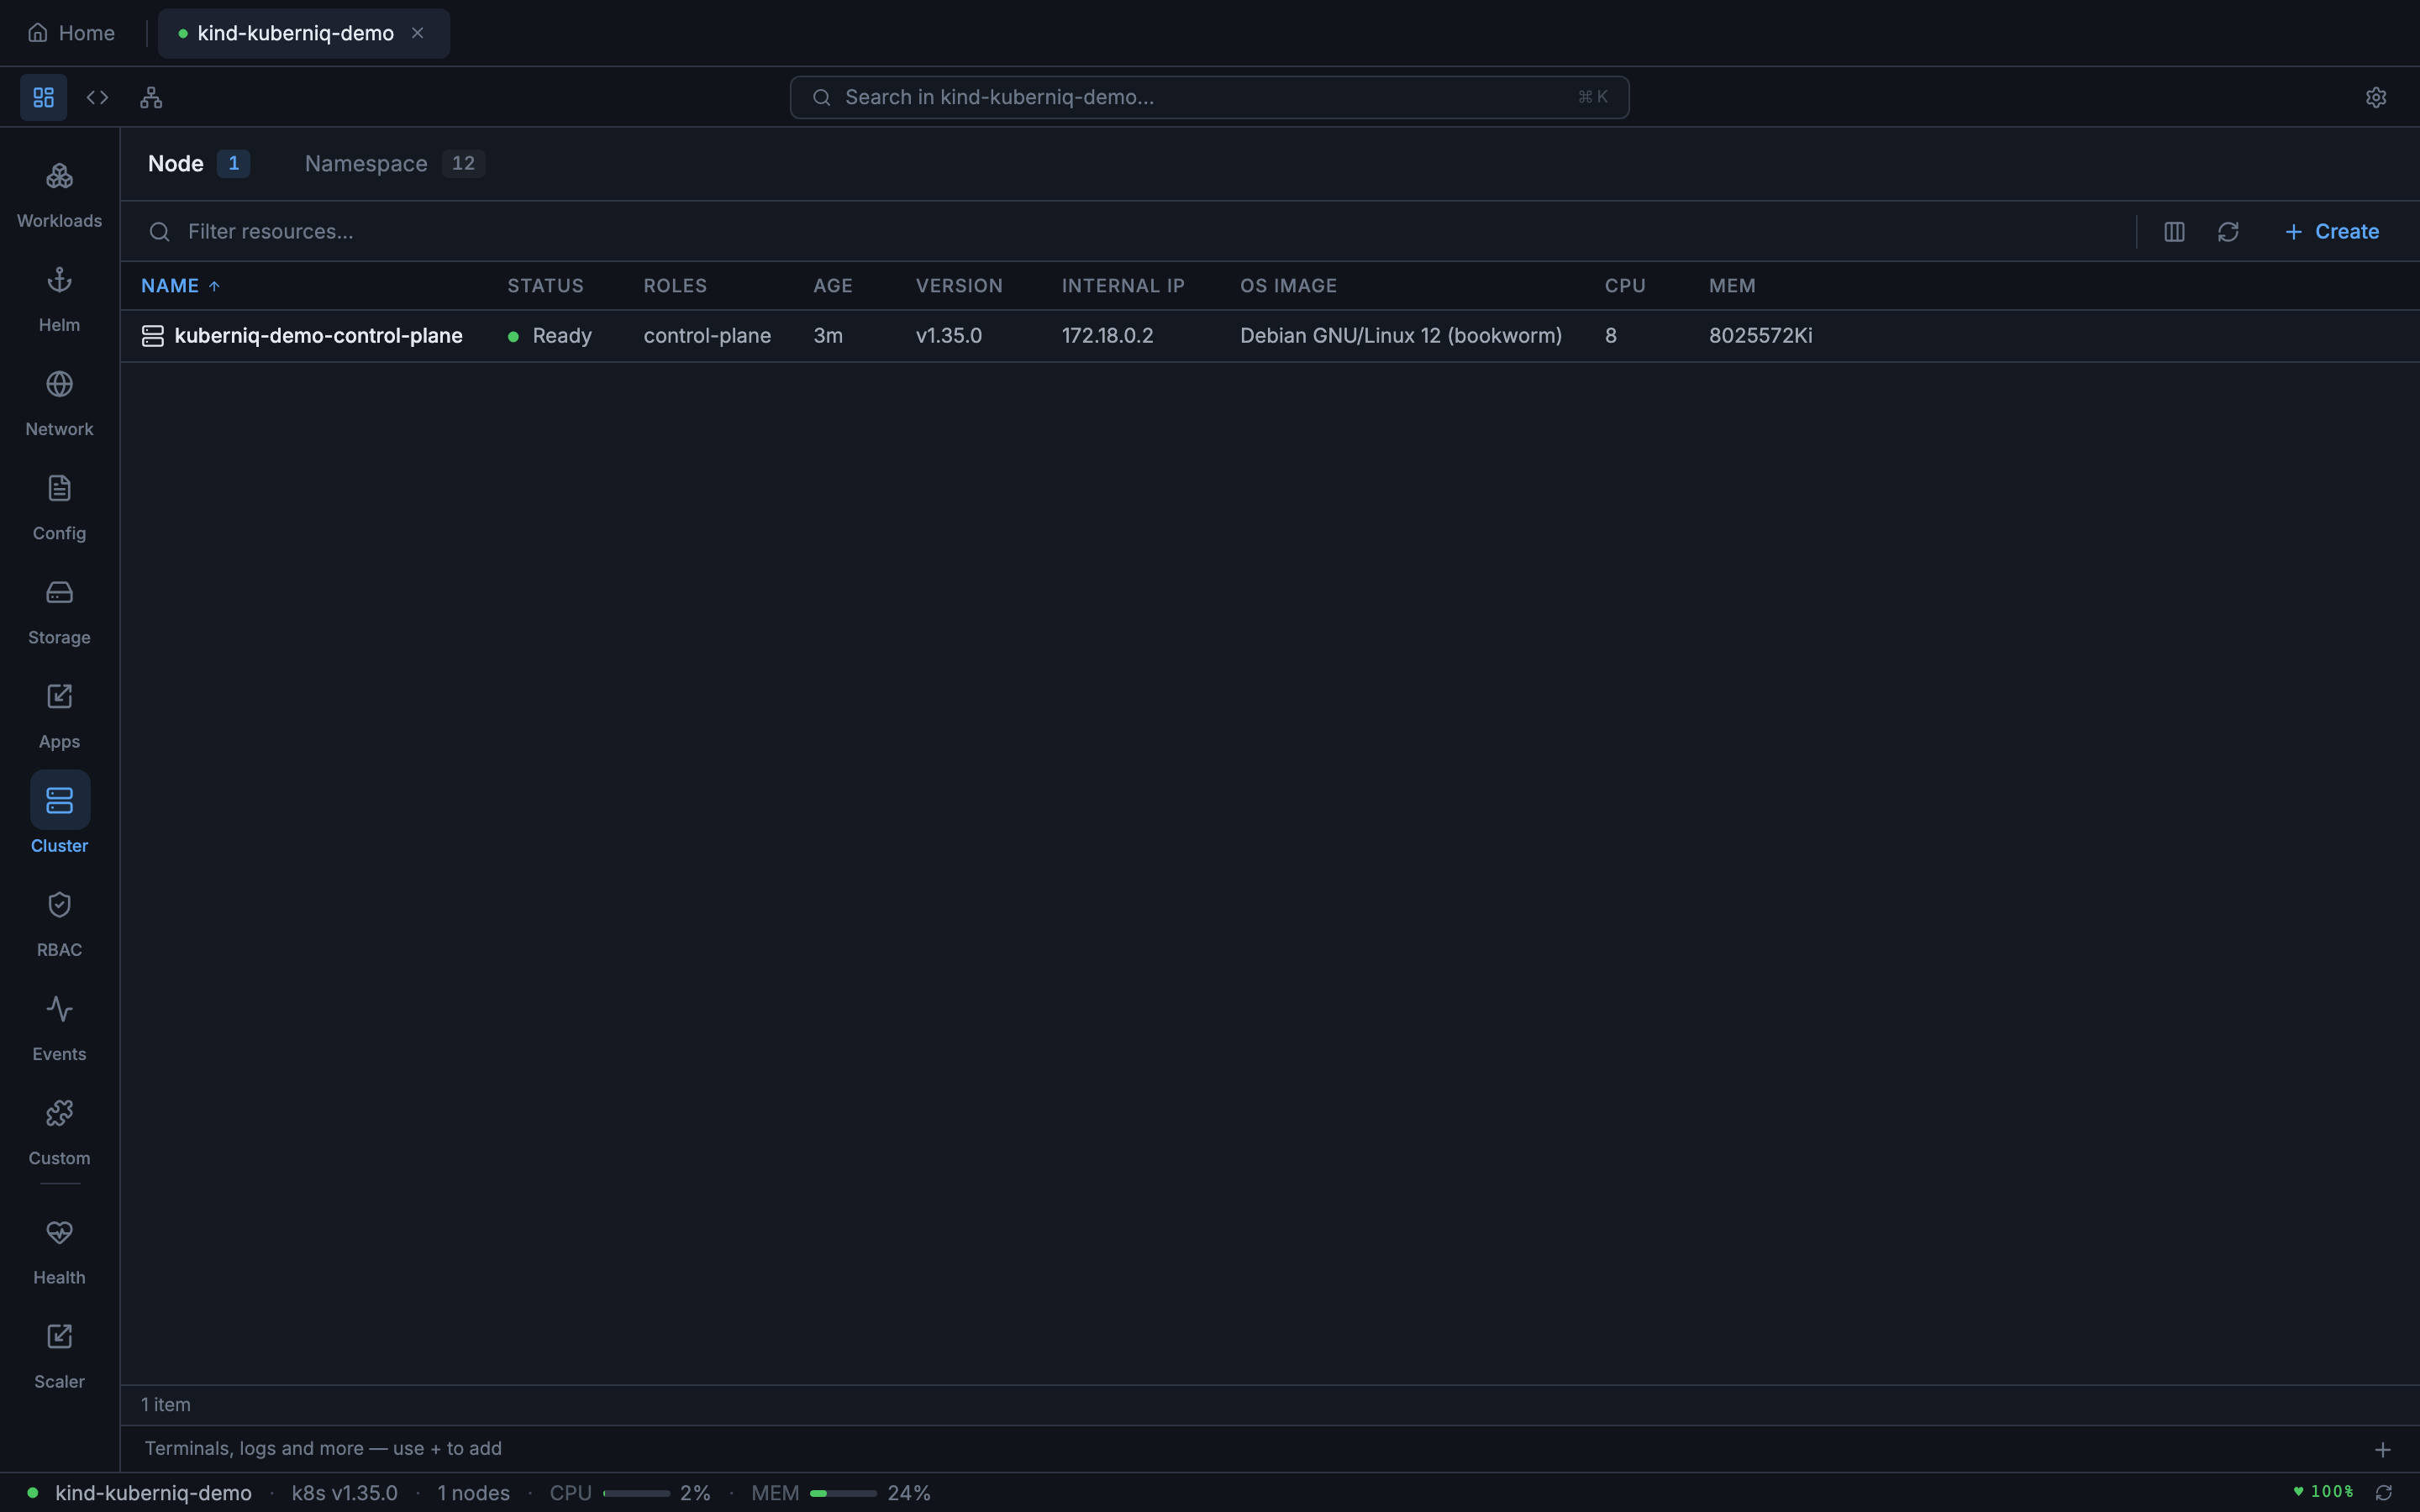
Cluster
- Nodes — Cluster nodes with roles, conditions, capacity, and allocatable resources
- Namespaces — Logical cluster partitions with status and label counts
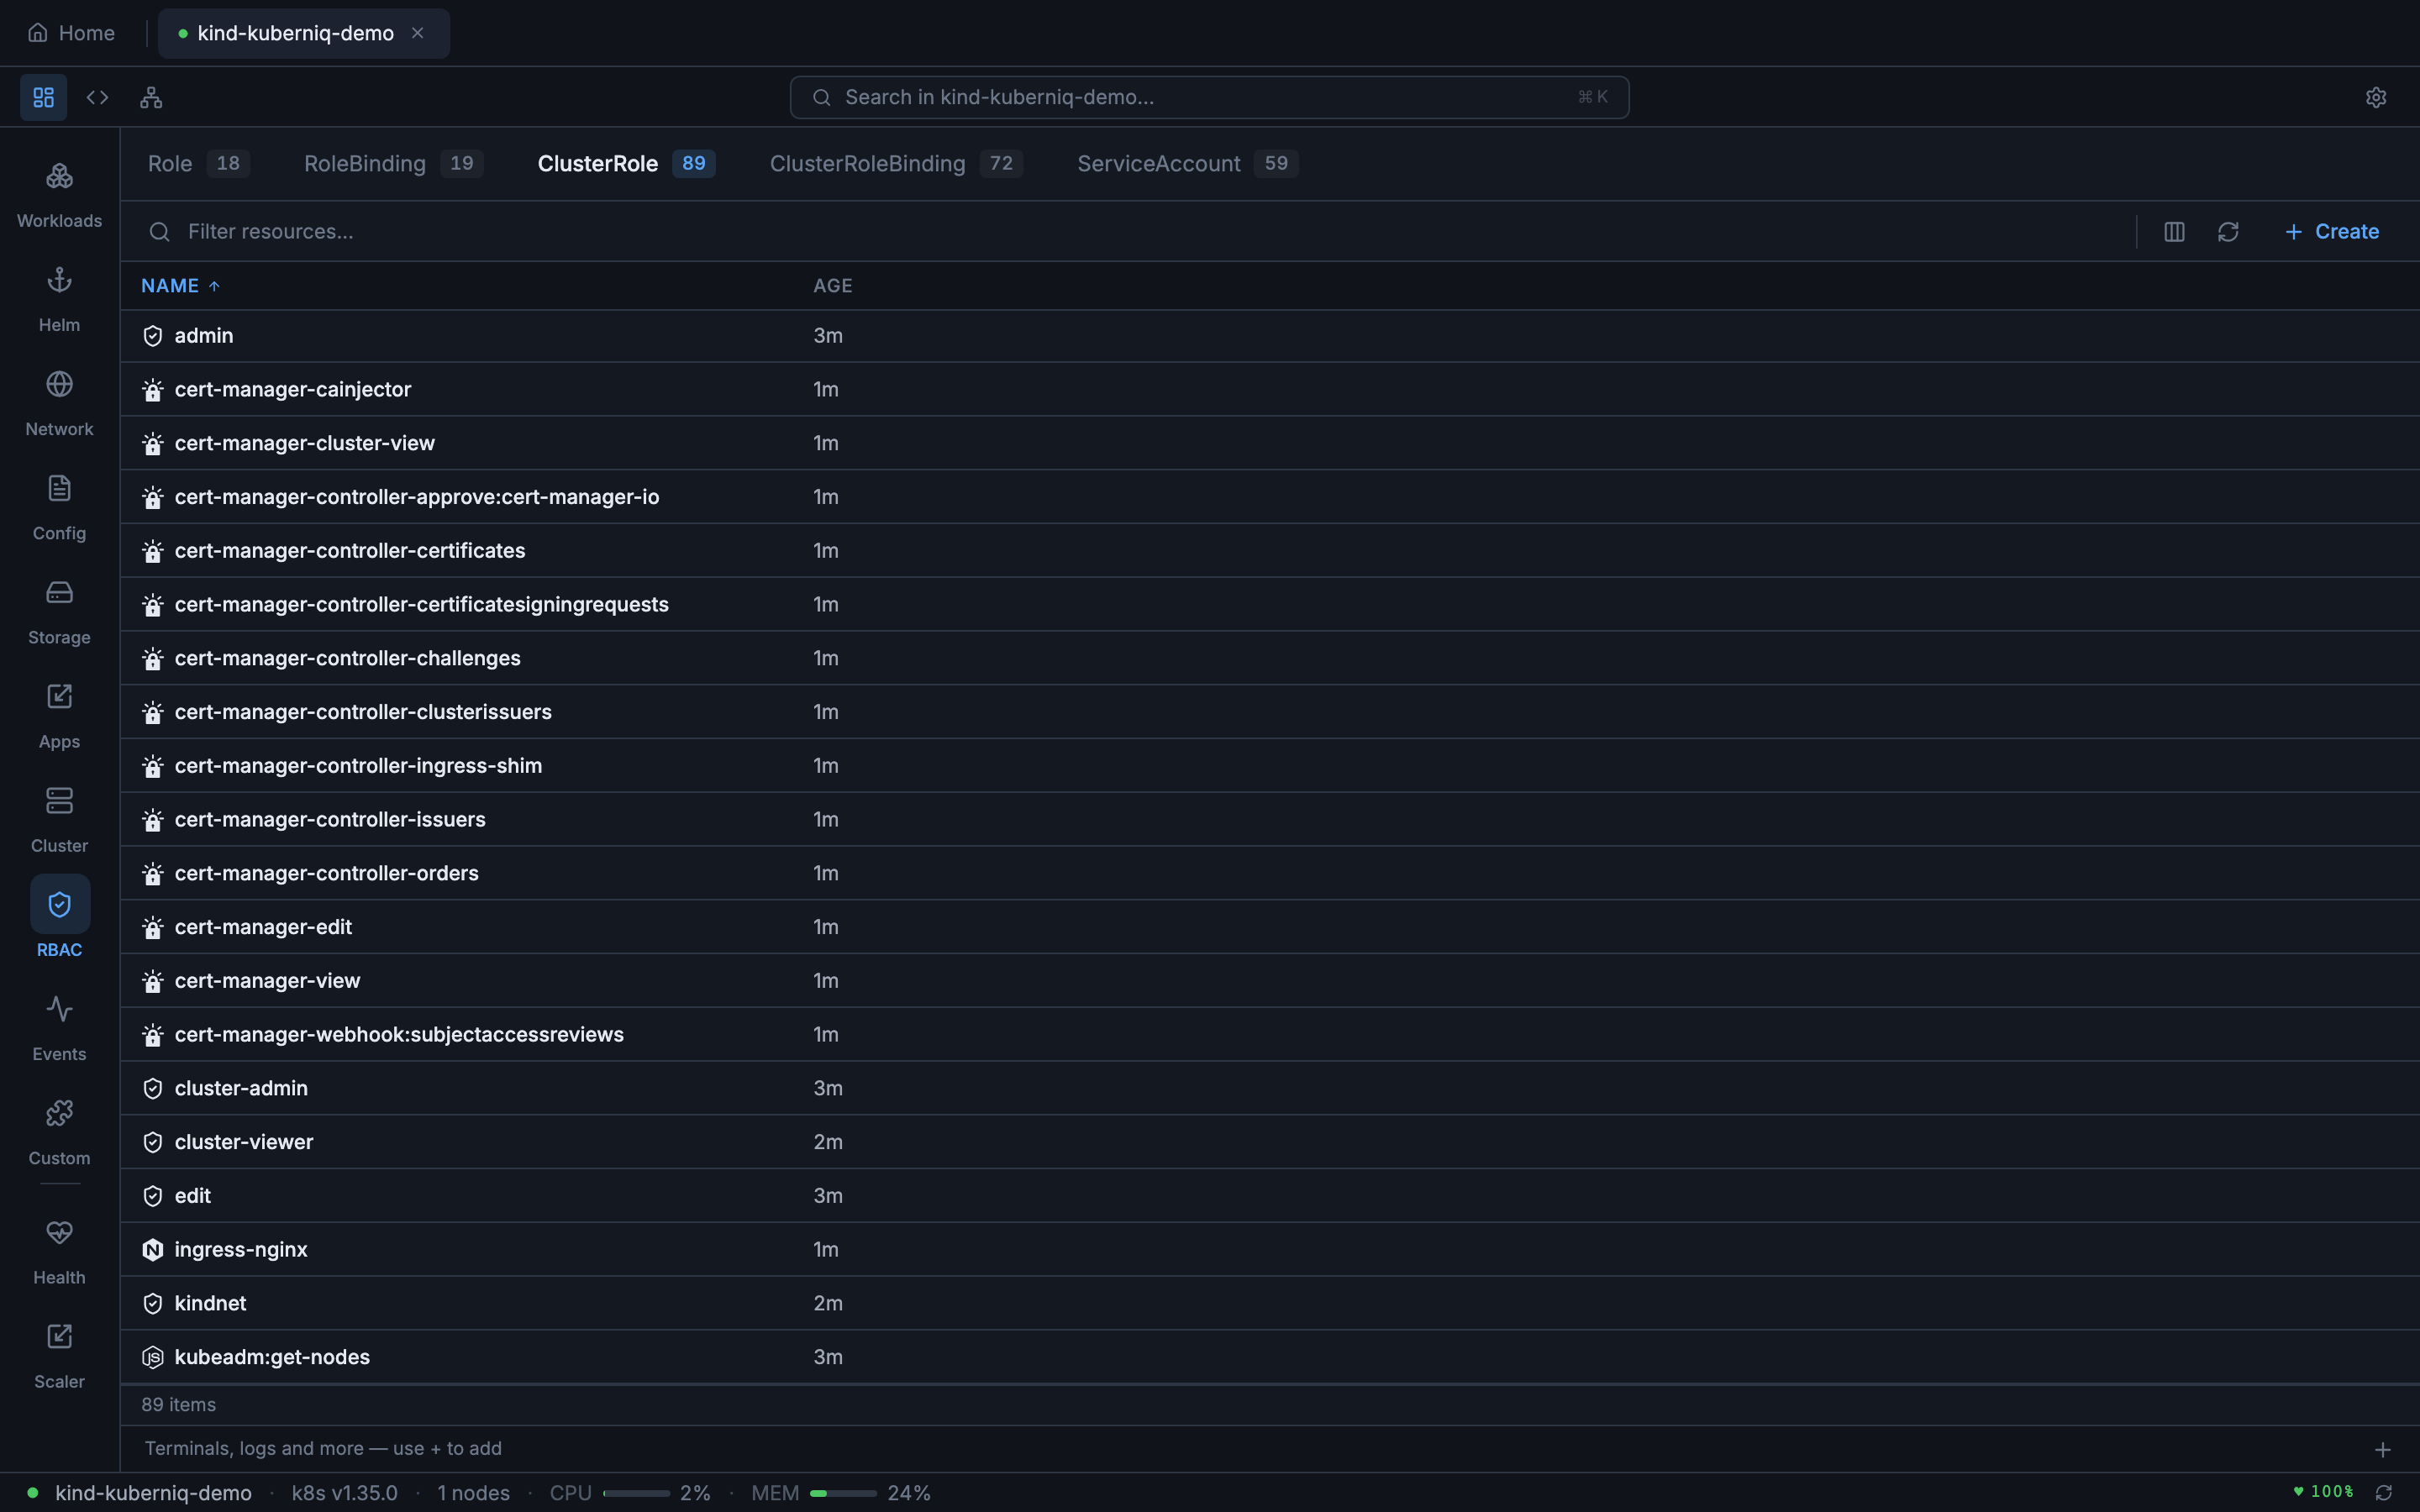
RBAC
- Roles — Namespace-scoped permission sets
- ClusterRoles — Cluster-wide permission sets
- RoleBindings — Namespace-scoped role assignments to users, groups, or service accounts
- ClusterRoleBindings — Cluster-wide role assignments
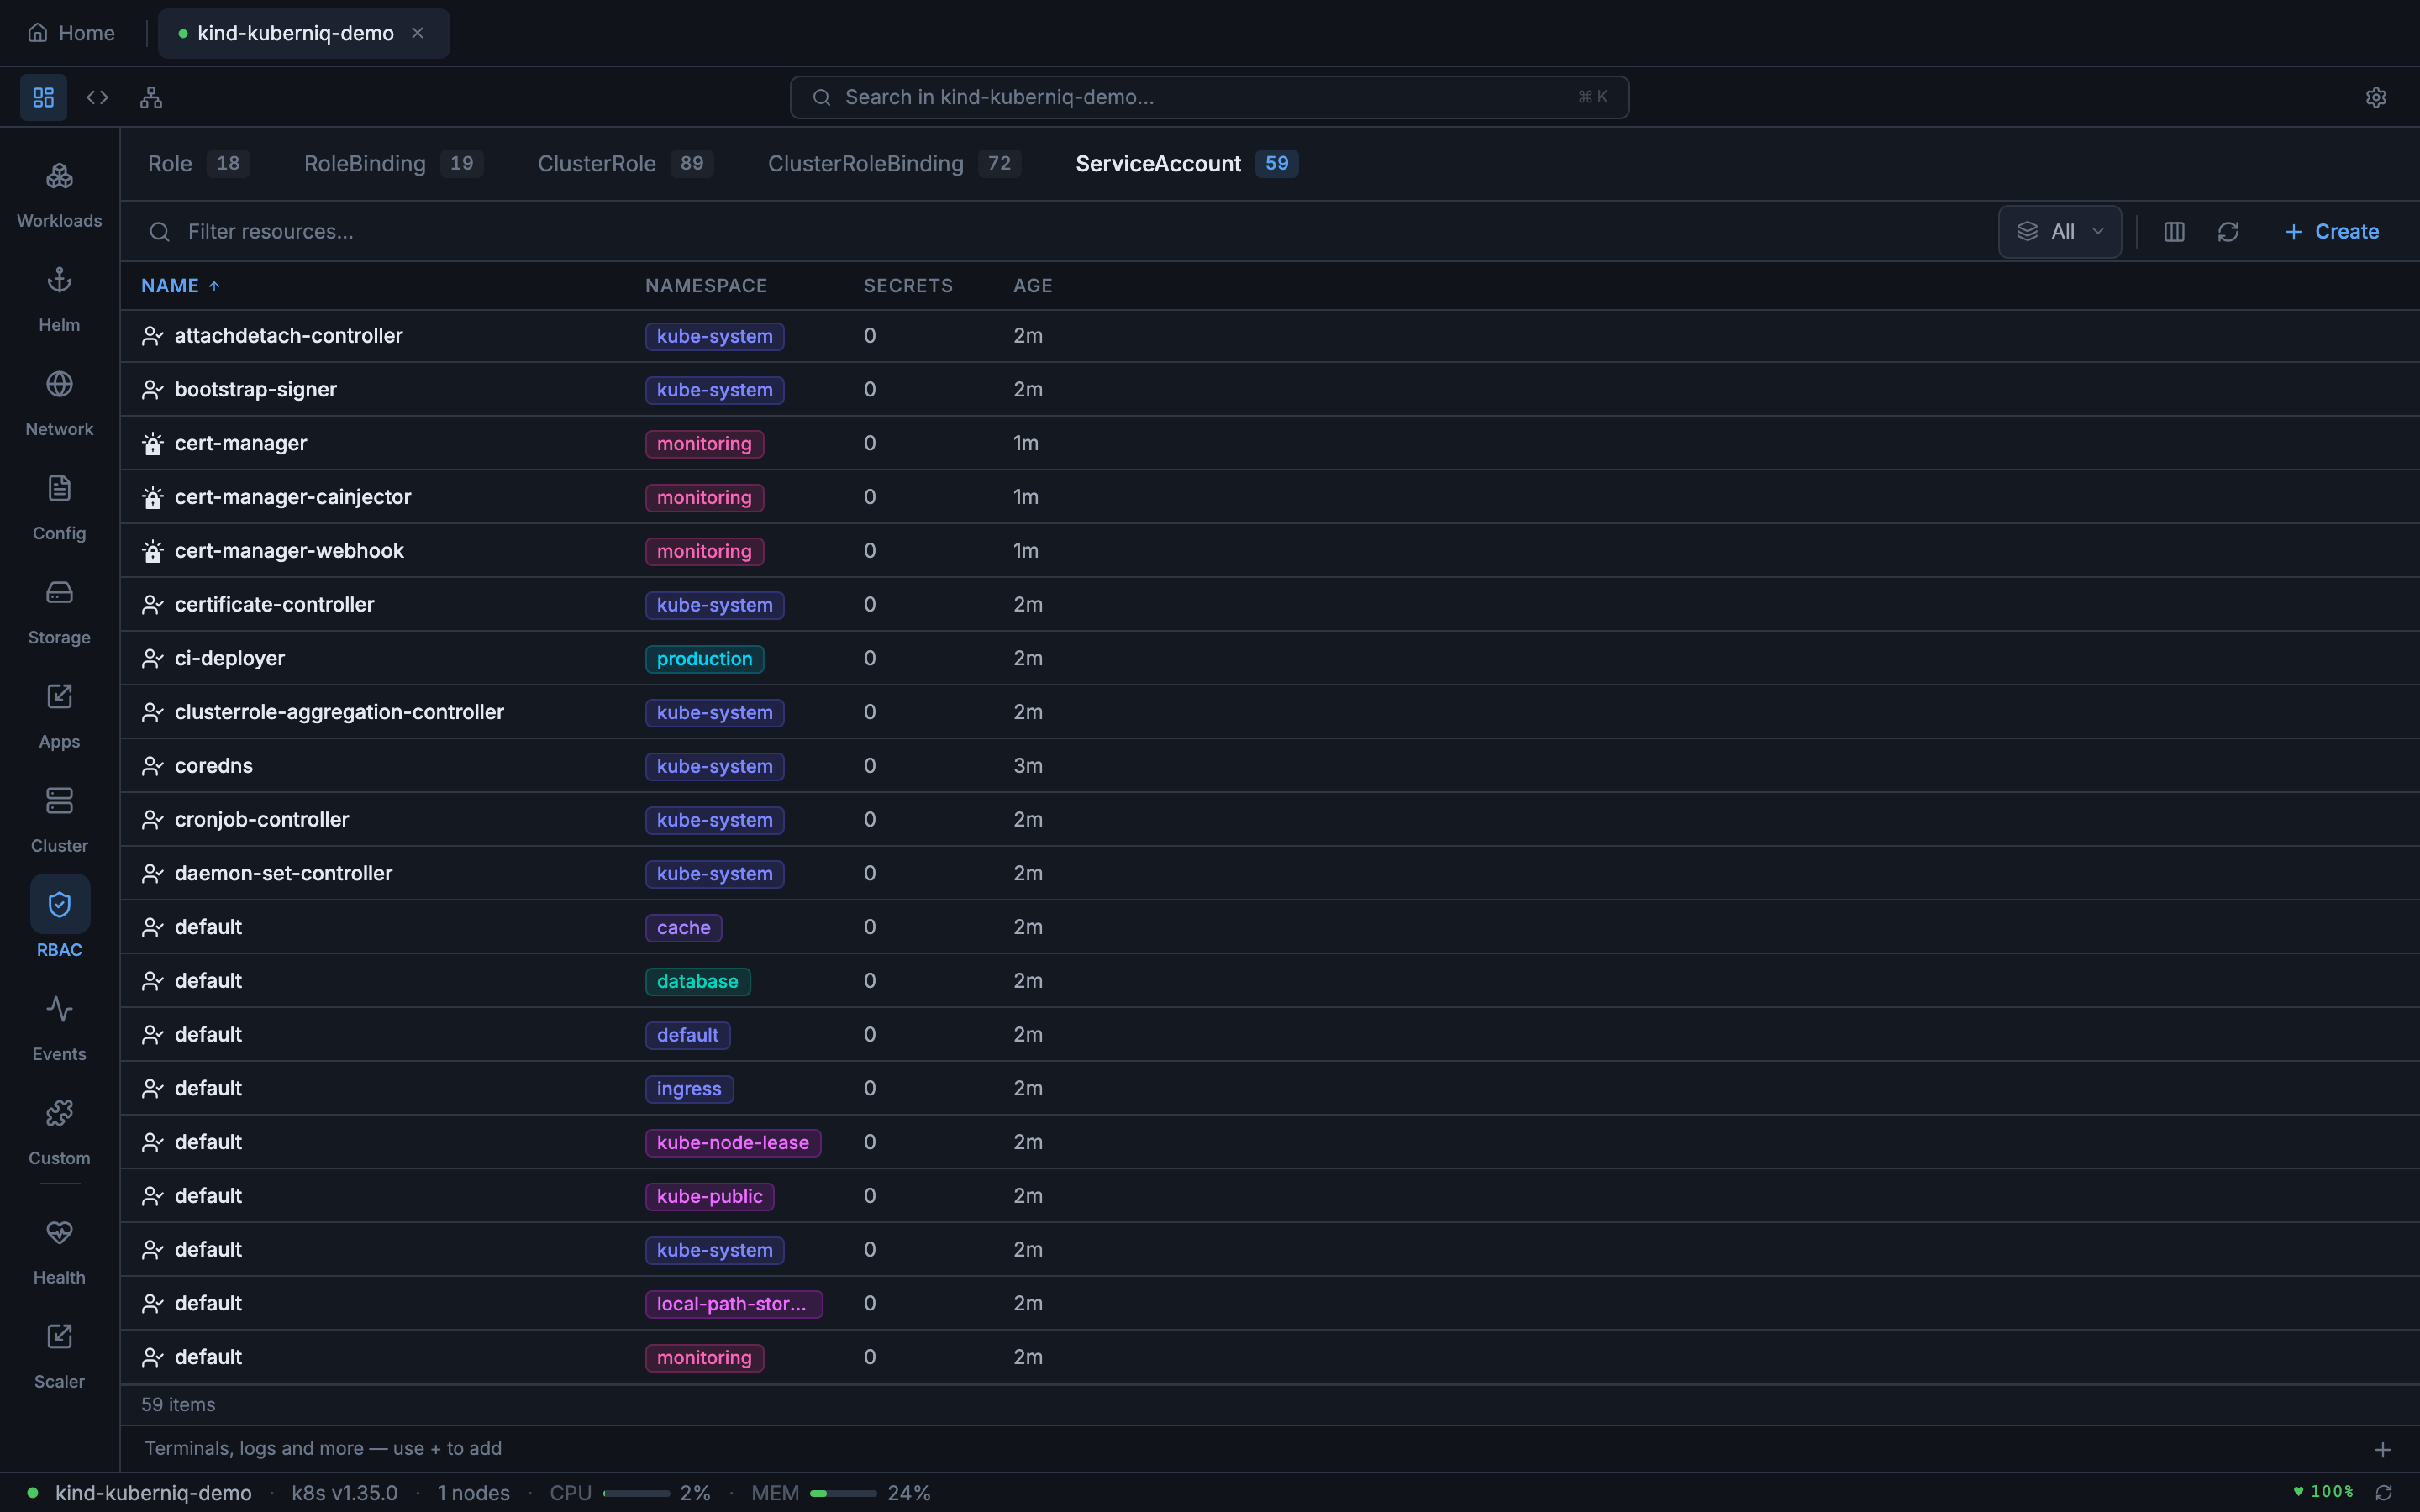
- ServiceAccounts — Pod identity accounts with secret and image pull secret references
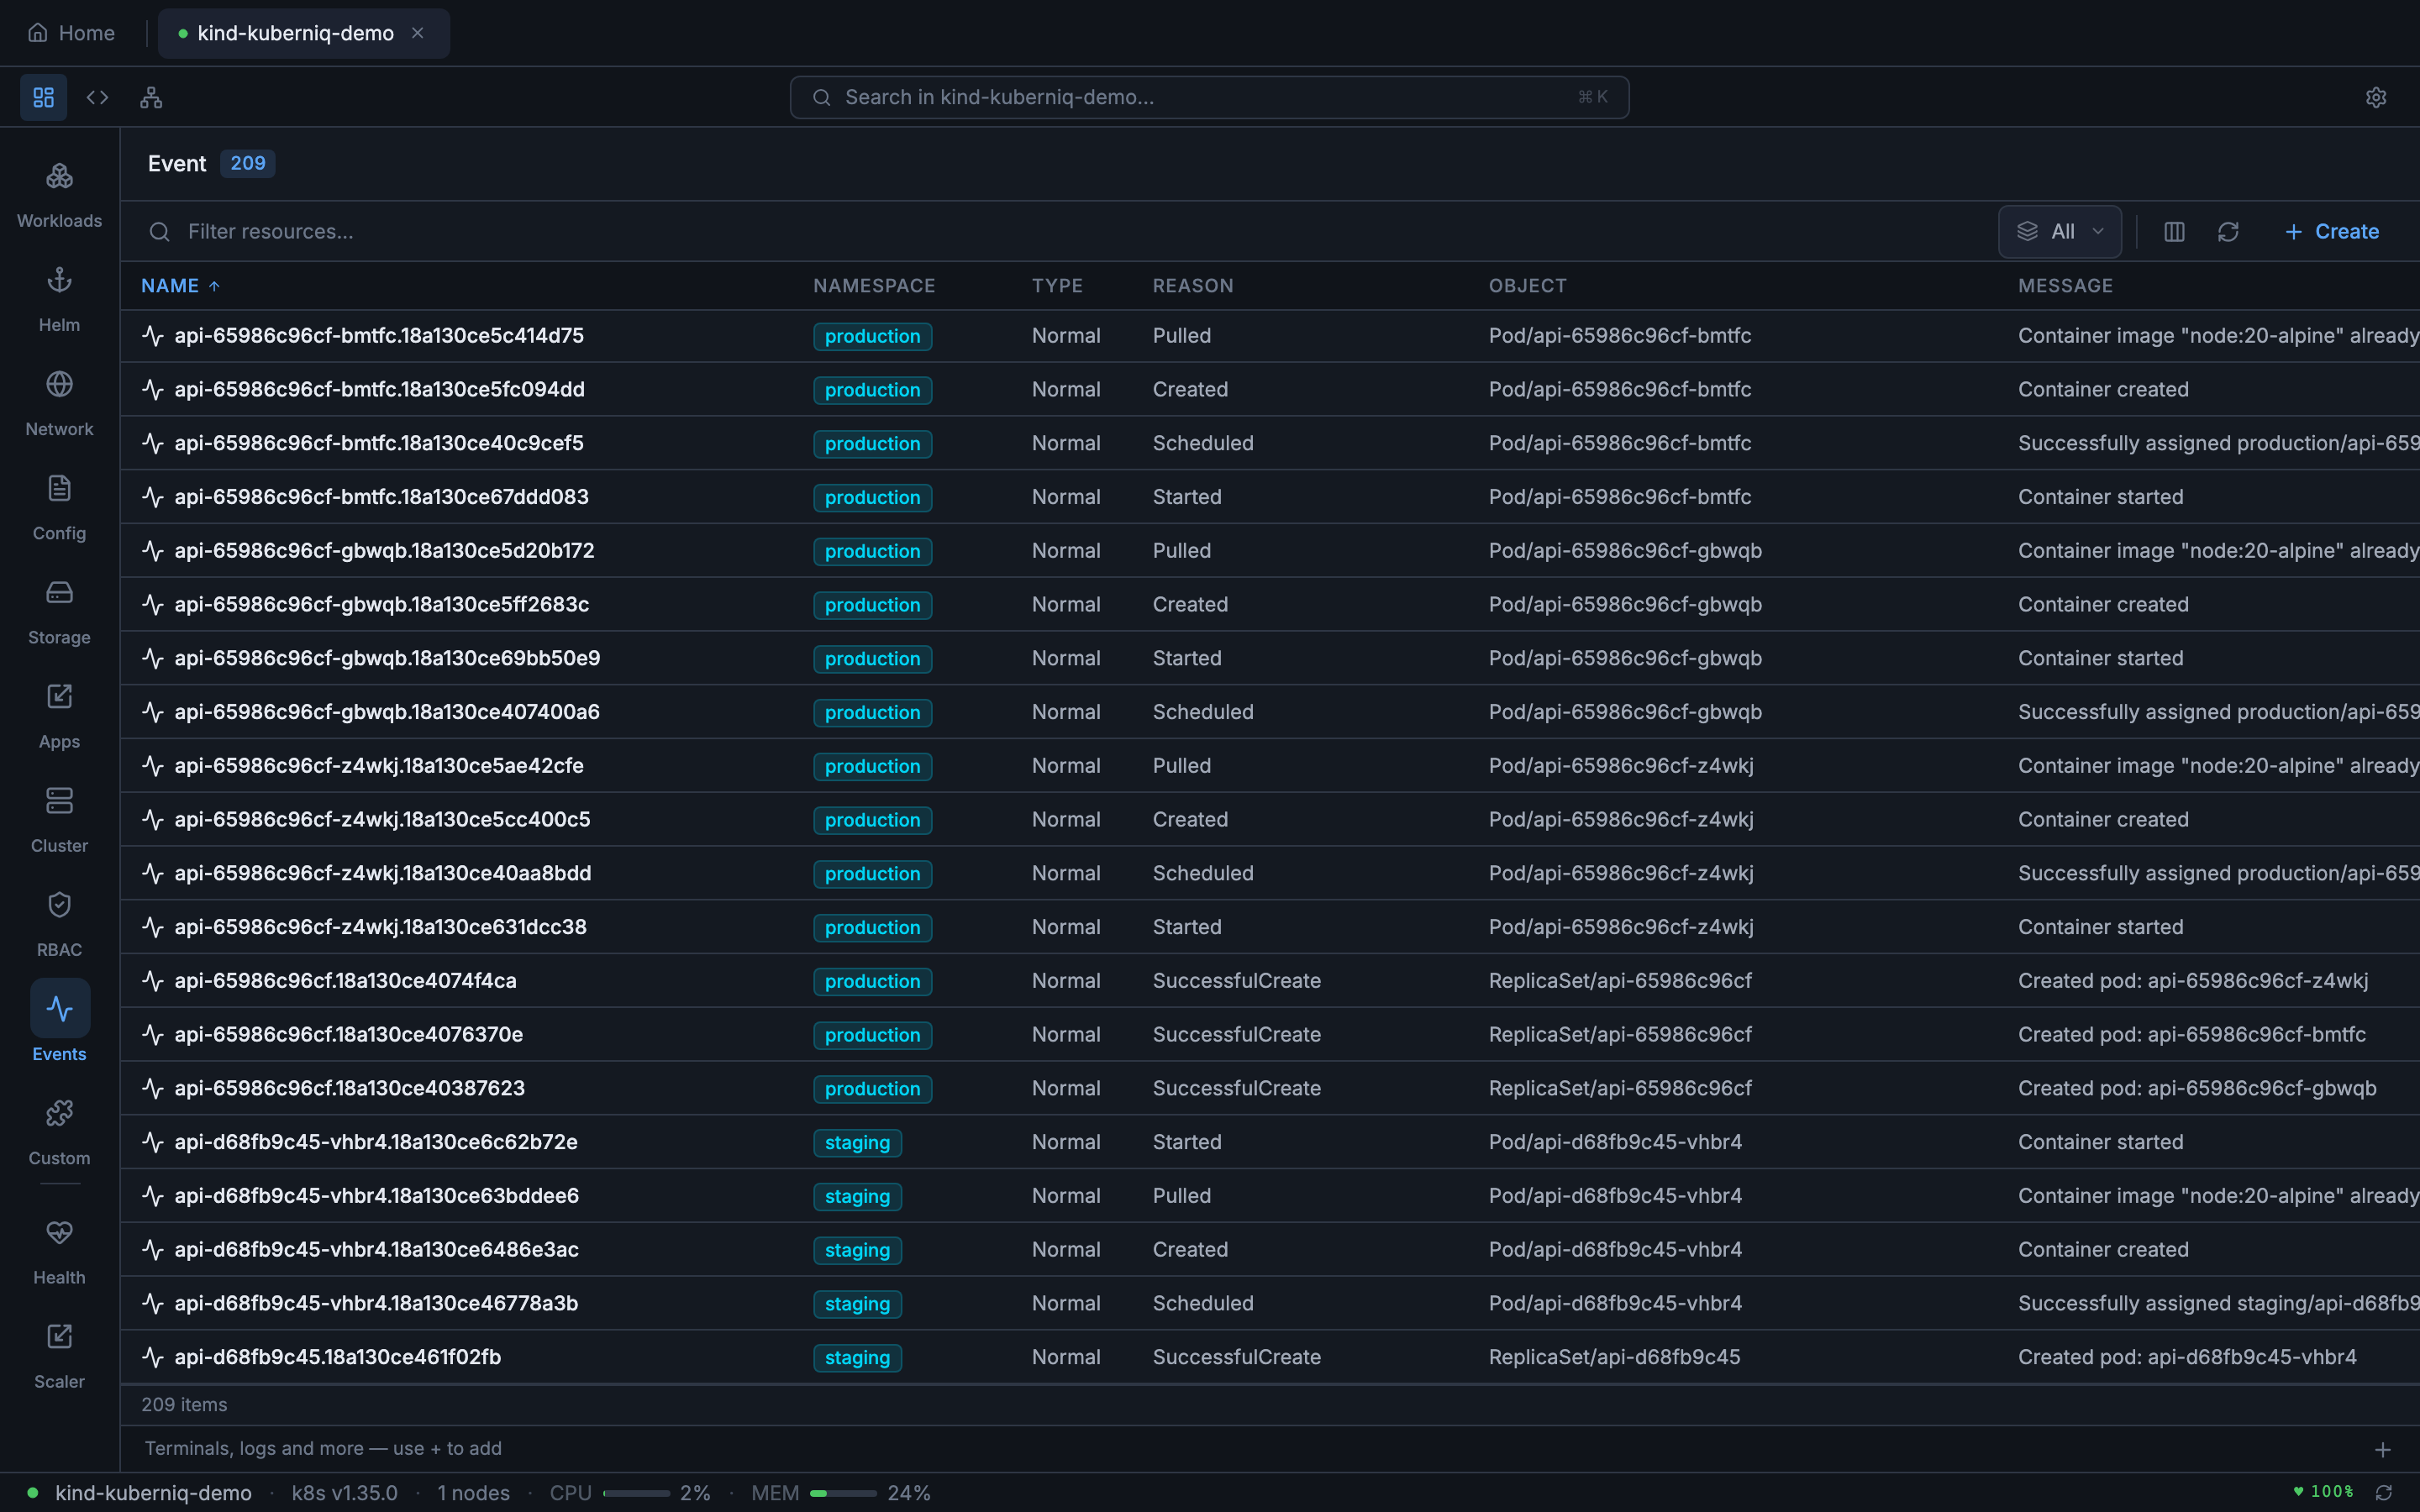
Events
- Events — Cluster-wide event stream with type (Normal, Warning), reason, source, and involved object
Resource Type Details
Here is a closer look at some of the resource types Kuberniq manages, with details on the columns and information displayed for each:
StatefulSets
StatefulSets are displayed with their ready replica count, current revision, and update strategy. Kuberniq shows the ordered pod identities (e.g., postgres-0, postgres-1) and their individual statuses, making it easy to identify which ordinal is having issues during rolling updates.
DaemonSets
DaemonSets show desired, current, ready, up-to-date, and available counts. Since DaemonSets run one pod per node, the desired count reflects the number of schedulable nodes. Kuberniq highlights mismatches between desired and ready counts, indicating nodes where the DaemonSet pod is not yet running.
CronJobs
CronJobs display the schedule expression, last schedule time, suspend state, and active job count. Kuberniq parses the cron expression and shows a human-readable description of the schedule alongside the raw expression.
Services
Services are shown with their type (ClusterIP, NodePort, LoadBalancer, ExternalName), cluster IP, external IP (for LoadBalancer types), and port mappings. The port column displays both the service port and target port for each defined port entry.
Ingresses
Ingress resources display their class, hosts, paths, and backend service references. Kuberniq shows TLS configuration status and the associated hosts, making it easy to verify routing rules at a glance.
NetworkPolicies
NetworkPolicy resources show the pod selector, policy types (Ingress, Egress), and the number of ingress and egress rules defined. This helps you quickly audit which pods have network restrictions applied.
ConfigMaps and Secrets
ConfigMaps show the number of data keys and the namespace they belong to. Secrets show the type (Opaque, kubernetes.io/tls, kubernetes.io/dockerconfigjson, etc.) and the number of data entries. Secret values are base64-decoded for display in the detail panel.
Storage Resources
PersistentVolumeClaims display their status (Bound, Pending, Lost), capacity, access modes, storage class, and the volume they are bound to. PersistentVolumes show the reclaim policy, capacity, and claim reference. StorageClasses show the provisioner, reclaim policy, and volume binding mode.
HorizontalPodAutoscalers
HPAs show the reference target (Deployment, StatefulSet, etc.), current and target metric values, minimum and maximum replica counts, and the current replica count. Kuberniq displays both CPU and custom metric targets when configured.
RBAC Resources
Roles and ClusterRoles show the number of rules defined. RoleBindings and ClusterRoleBindings show the subjects (users, groups, service accounts) and the role they reference. ServiceAccounts display the namespace, associated secrets, and image pull secret references.
Nodes and Namespaces
Nodes display their roles, conditions (Ready, MemoryPressure, DiskPressure, PIDPressure), kernel version, container runtime, and allocatable CPU/memory. Namespaces show their status and label counts.
Events
The event stream shows all cluster events with their type (Normal or Warning), reason, source component, involved object, message, and timestamp. Events are streamed in real-time and color-coded by type for quick scanning.
Resource Tables
Each resource type is displayed in a sortable table with columns specific to that resource kind. Common columns include name, namespace (shown as a colored badge), age, and status. Click any column header to sort ascending or descending.
When viewing resources across all namespaces, each row displays a colored namespace badge that makes it easy to visually group resources by namespace. Status indicators use Lens-style ready dots — green for healthy, yellow for progressing, and red for errors.
CRUD Operations
- Create — Open the YAML editor and define a new resource from scratch or from a template. Apply it to your cluster with a single click.
- View — Click any resource row to open the detail slide-over panel showing structured information, related resources, and contextual actions.
- Edit — Open the resource in the YAML editor with its current manifest pre-loaded. Make changes and apply them directly.
- Delete — Remove a resource with a confirmation dialog. Supports foreground and background propagation policies.
Filtering
You can filter resources using label selectors and field selectors, the same syntax used by
kubectl:
- Label selectors:
app=nginx,env in (prod, staging),!canary - Field selectors:
status.phase=Running,metadata.name=my-pod
For large clusters, Kuberniq paginates resource listings using the Kubernetes API's
continue token mechanism, loading resources in batches to keep the UI responsive.
Real-Time Updates
When you view a resource list, Kuberniq opens a WebSocket watch stream to the Kubernetes API. As resources are created, modified, or deleted in the cluster, the table updates instantly:
- ADDED — New rows appear at the appropriate position in the sorted table.
- MODIFIED — Existing rows update their values (status, replicas, conditions, etc.) in place.
- DELETED — Rows are removed from the table.
This means you never need to manually refresh. If a colleague scales a deployment, restarts a pod, or applies a new ConfigMap, you see the change immediately.
Custom Resource Definitions
Kuberniq automatically discovers Custom Resource Definitions (CRDs) installed in your cluster. When CRDs are detected, their custom resources appear in the sidebar under the appropriate API group. You can view, edit, and delete custom resources the same way you manage built-in resource types. CRD discovery runs when you connect to a cluster and updates when CRDs are added or removed.
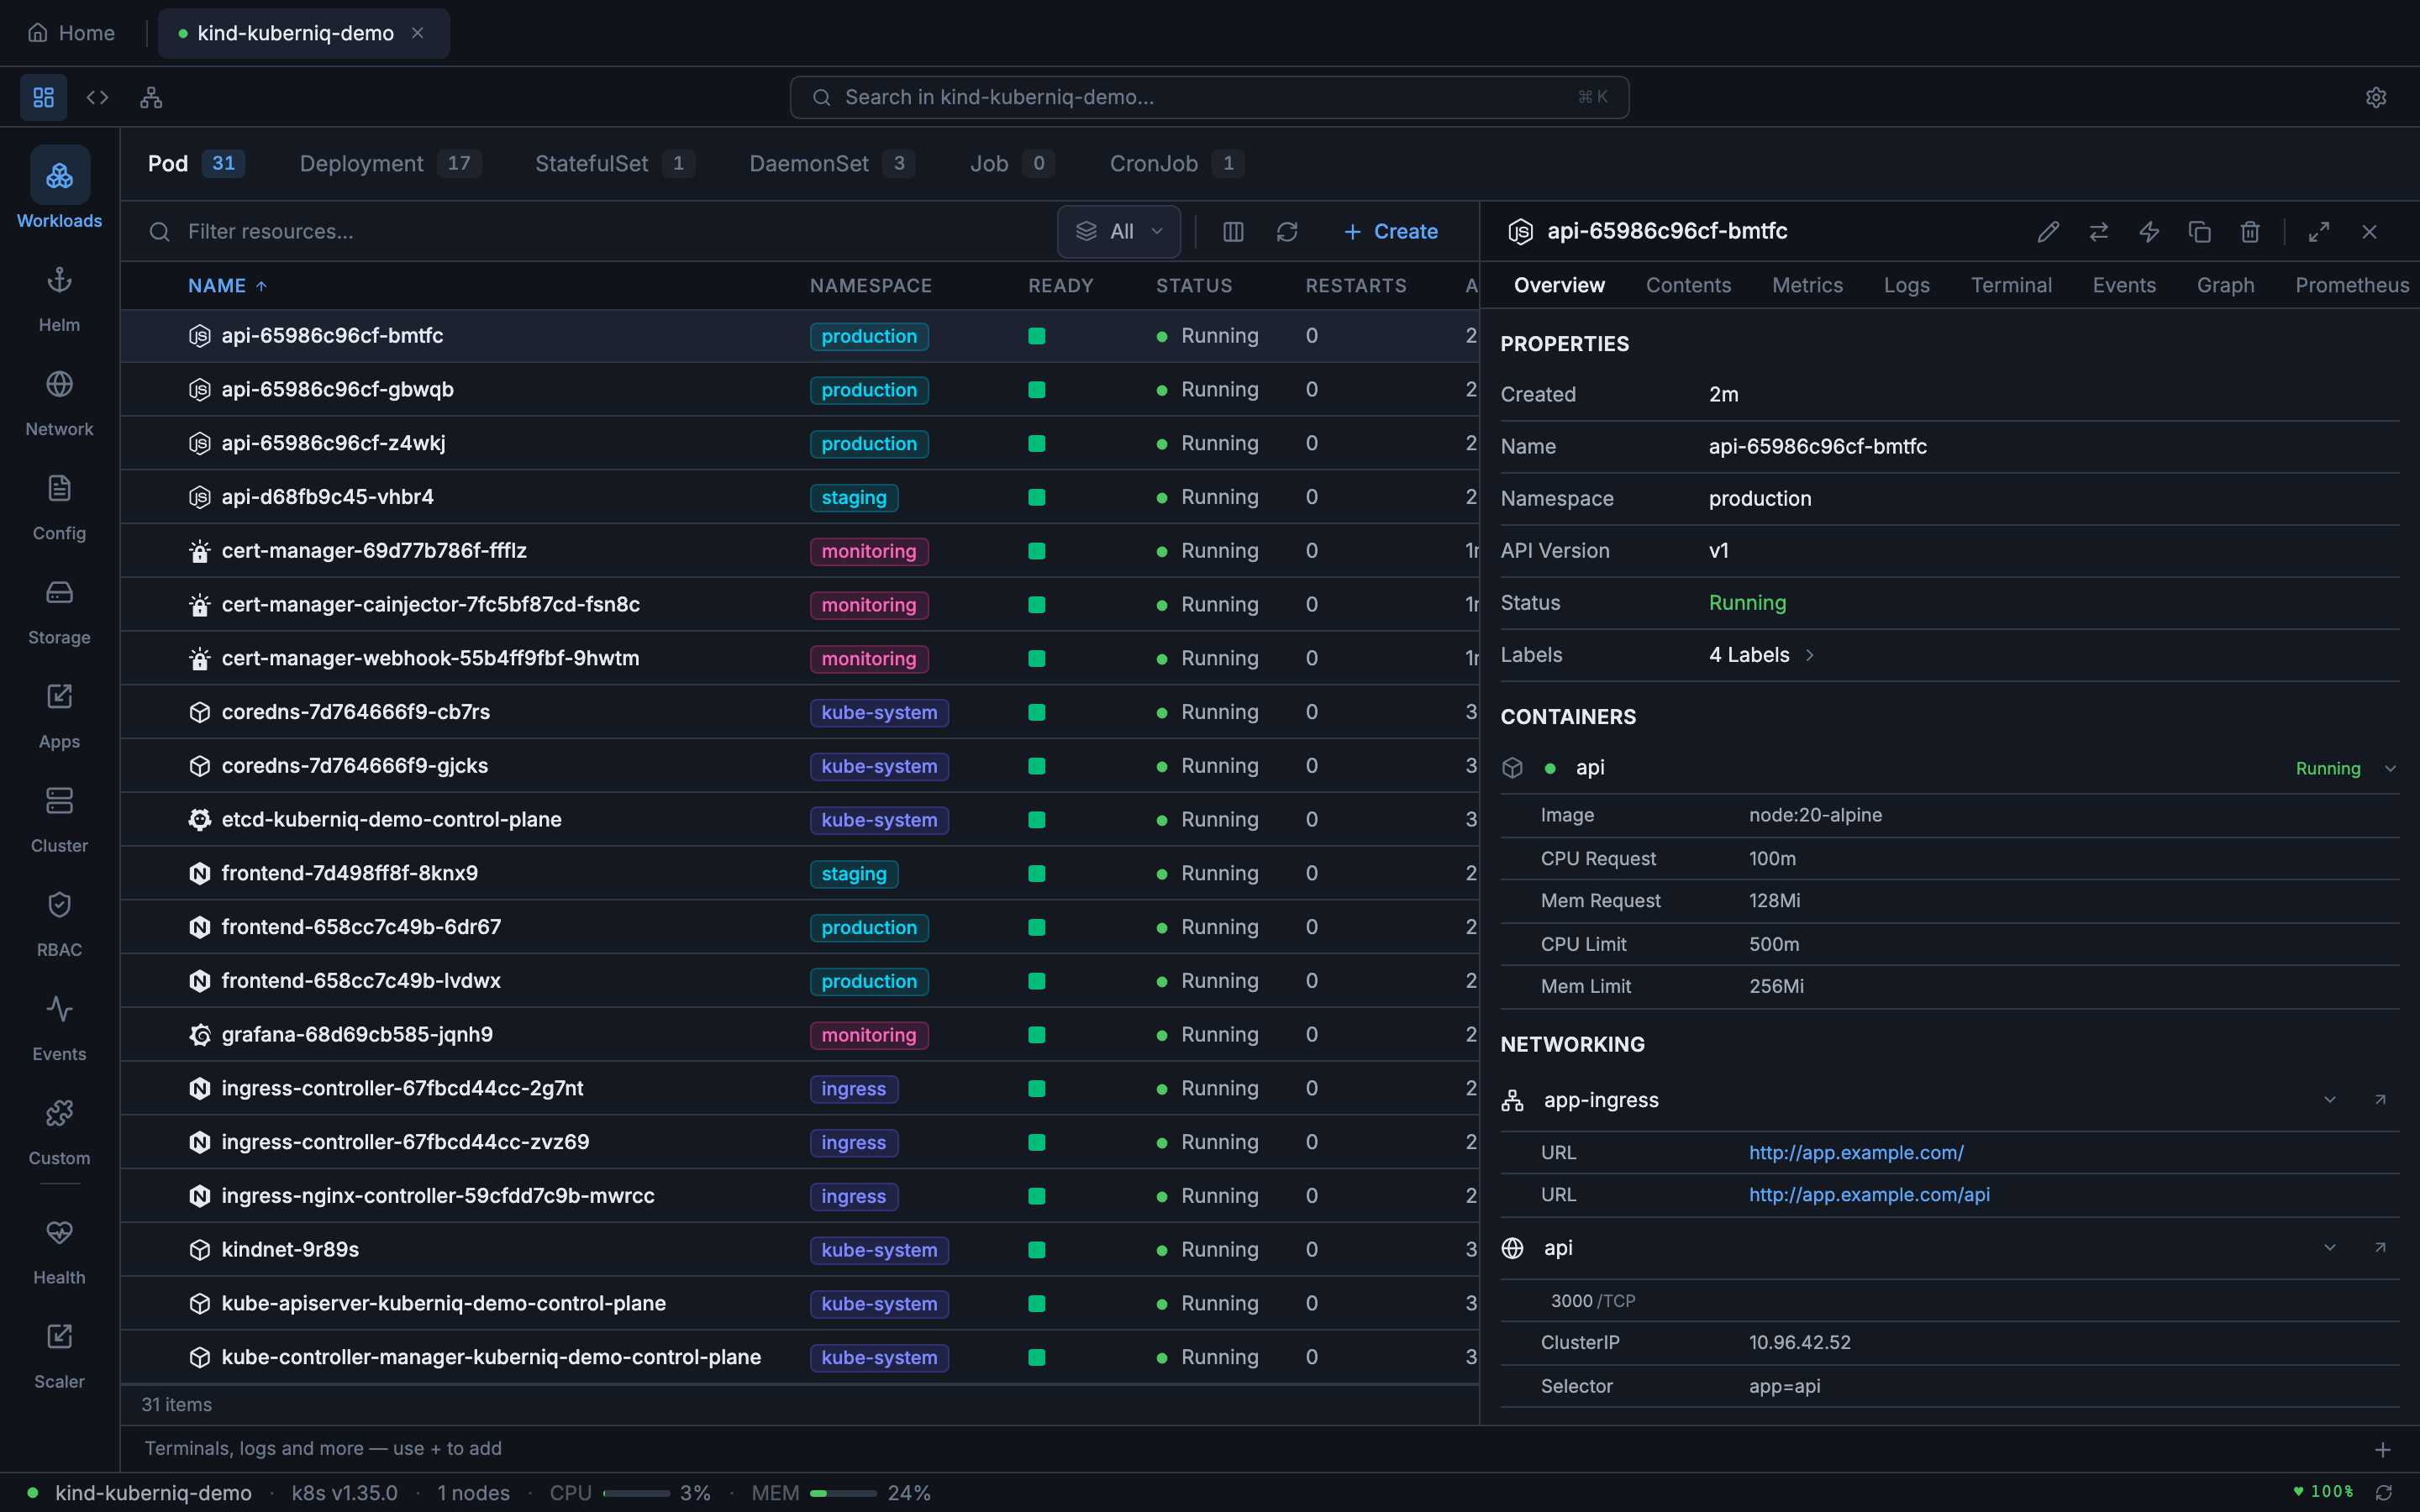
Detail Panel
Clicking a resource row opens a slide-over detail panel on the right side of the screen. The panel contains tabs that vary depending on the resource type:
- Overview — Structured display of metadata, spec, and status fields with labels, annotations, and ownership references.
- Contents — File browser for container filesystems and mounted volumes (Pods, PVCs, and workload resources).
- Metrics — CPU and memory charts for applicable resources (see Metrics & Monitoring).
- Values — Current Helm values YAML for Helm releases.
- History — Revision history with rollback options for Helm releases.
- Logs — Real-time log streaming for Pods (see Log Streaming).
- Terminal — Exec into running containers (see Pod Terminal).
- Events — Events related to the selected resource, filtered by involved object.
- Graph — Interactive relationship visualization showing resource dependencies (see Resource Graph).
- Prometheus — Custom PromQL queries with interactive chart visualization (see Prometheus Queries).
The Events tab in the detail panel filters the cluster event stream to show only events related to the selected resource. This makes it easy to see scheduling decisions, image pull events, container start/stop events, and any warnings specific to that resource.