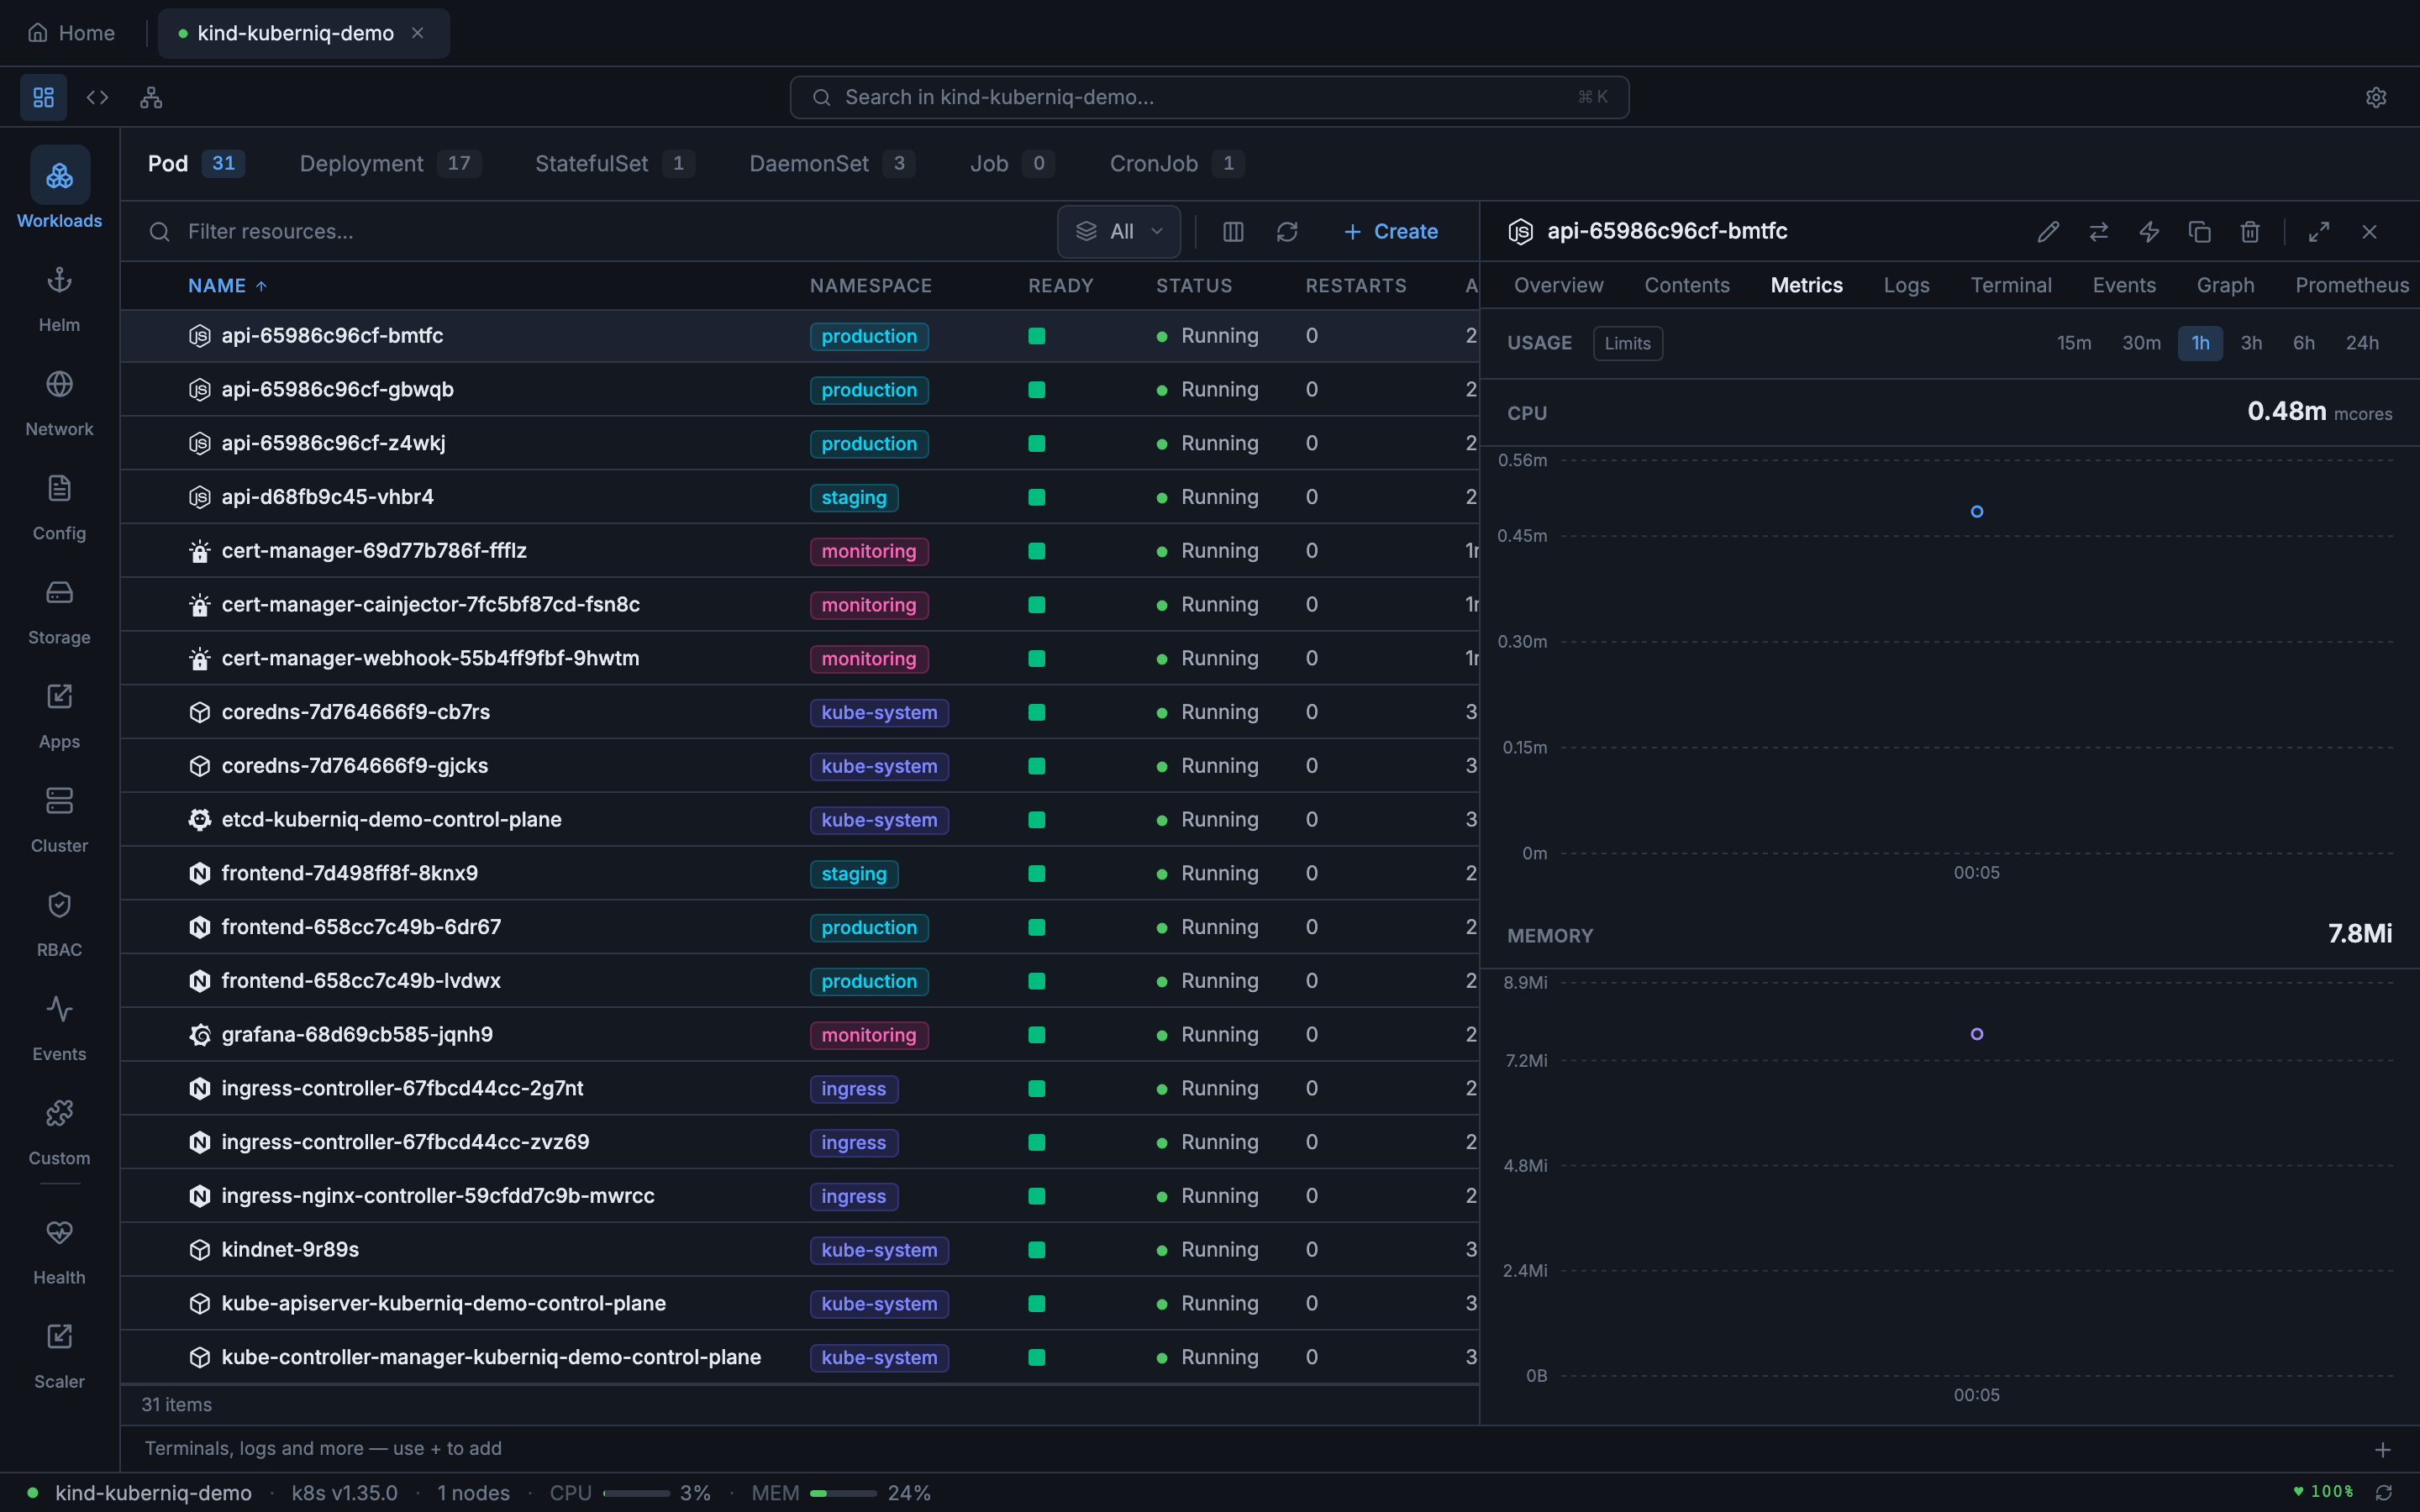
Metrics & Monitoring
Kuberniq provides built-in CPU and memory usage charts for pods, workloads, and nodes. Metrics are displayed as interactive time-series charts powered by Recharts, with configurable time ranges and automatic data source detection. No additional configuration is required — if your cluster has metrics-server or Prometheus, Kuberniq starts collecting data automatically.
Data Sources
Kuberniq supports two metrics data sources with automatic fallback:
- Prometheus — When Prometheus is detected in your cluster, Kuberniq queries
it for historical metrics data using PromQL. This provides richer time-series data with
higher resolution and longer retention. Kuberniq auto-detects Prometheus by looking for
a Service matching common naming conventions (e.g.,
prometheus-server,prometheus-kube-prometheus-prometheus). - Kubernetes metrics-server — When Prometheus is unavailable, Kuberniq falls
back to the Kubernetes metrics API (
metrics.k8s.io/v1beta1). The metrics-server provides current-point-in-time CPU and memory usage. Kuberniq polls the metrics API at regular intervals and builds a time-series history in memory.
The active data source is shown in the metrics panel header so you always know where the data is coming from.
Time Ranges
You can adjust the time range displayed in the charts using the range selector. Available options:
- 15 minutes — High-resolution view for active debugging
- 30 minutes — Slightly wider window for recent activity
- 1 hour — Default range, good for general monitoring
- 3 hours — Useful for observing patterns over a work session
- 6 hours — Half-day overview
- 24 hours — Full-day view for identifying daily patterns
When using Prometheus as the data source, historical data is available for the full range. When using metrics-server, the time range is limited to the data collected since Kuberniq connected to the cluster (up to 24 hours of in-memory history).
In-Memory Time-Series Buffer
Kuberniq maintains an in-memory time-series buffer that stores up to 24 hours of metrics data per resource. When using the metrics-server, data points are collected at regular intervals and appended to this buffer. This allows you to view historical trends even though the metrics-server itself only provides current-point-in-time data. The buffer is per-cluster and is cleared when you disconnect from a cluster.
Usage Display
Current resource usage is displayed in human-readable format alongside the charts:
- CPU — Shown in cores (e.g., 0.5 cores) or millicores (e.g., 250m) depending on the magnitude
- Memory — Shown in MiB or GiB (e.g., 256 Mi, 1.5 Gi) using binary units consistent with Kubernetes conventions
When resource limits are defined on the container, the charts display a horizontal limit line and the current usage as a percentage of the limit (e.g., "128 Mi / 512 Mi — 25%"). This makes it easy to identify resources approaching their limits before they trigger OOM kills or CPU throttling.
Supported Resources
Metrics charts are available in the detail panel for the following resource types:
- Pods — Per-container CPU and memory usage
- Deployments — Aggregated metrics across all pods managed by the Deployment
- StatefulSets — Aggregated metrics across all pods in the set
- DaemonSets — Aggregated metrics across all pods in the DaemonSet
- Nodes — Node-level CPU and memory usage with capacity and allocatable values
Caching
Metrics API responses are cached with a 30-second TTL to reduce load on the metrics-server or Prometheus instance. This means that rapidly switching between resource details does not generate a burst of API requests. The cache is per-resource and is invalidated when the TTL expires or when you manually refresh the metrics panel.
Custom Prometheus Queries
For advanced use cases, Kuberniq provides a dedicated Prometheus tab in the detail panel where you can write custom PromQL queries and visualize the results as interactive charts. See the Prometheus Queries documentation for details.