Prometheus Queries
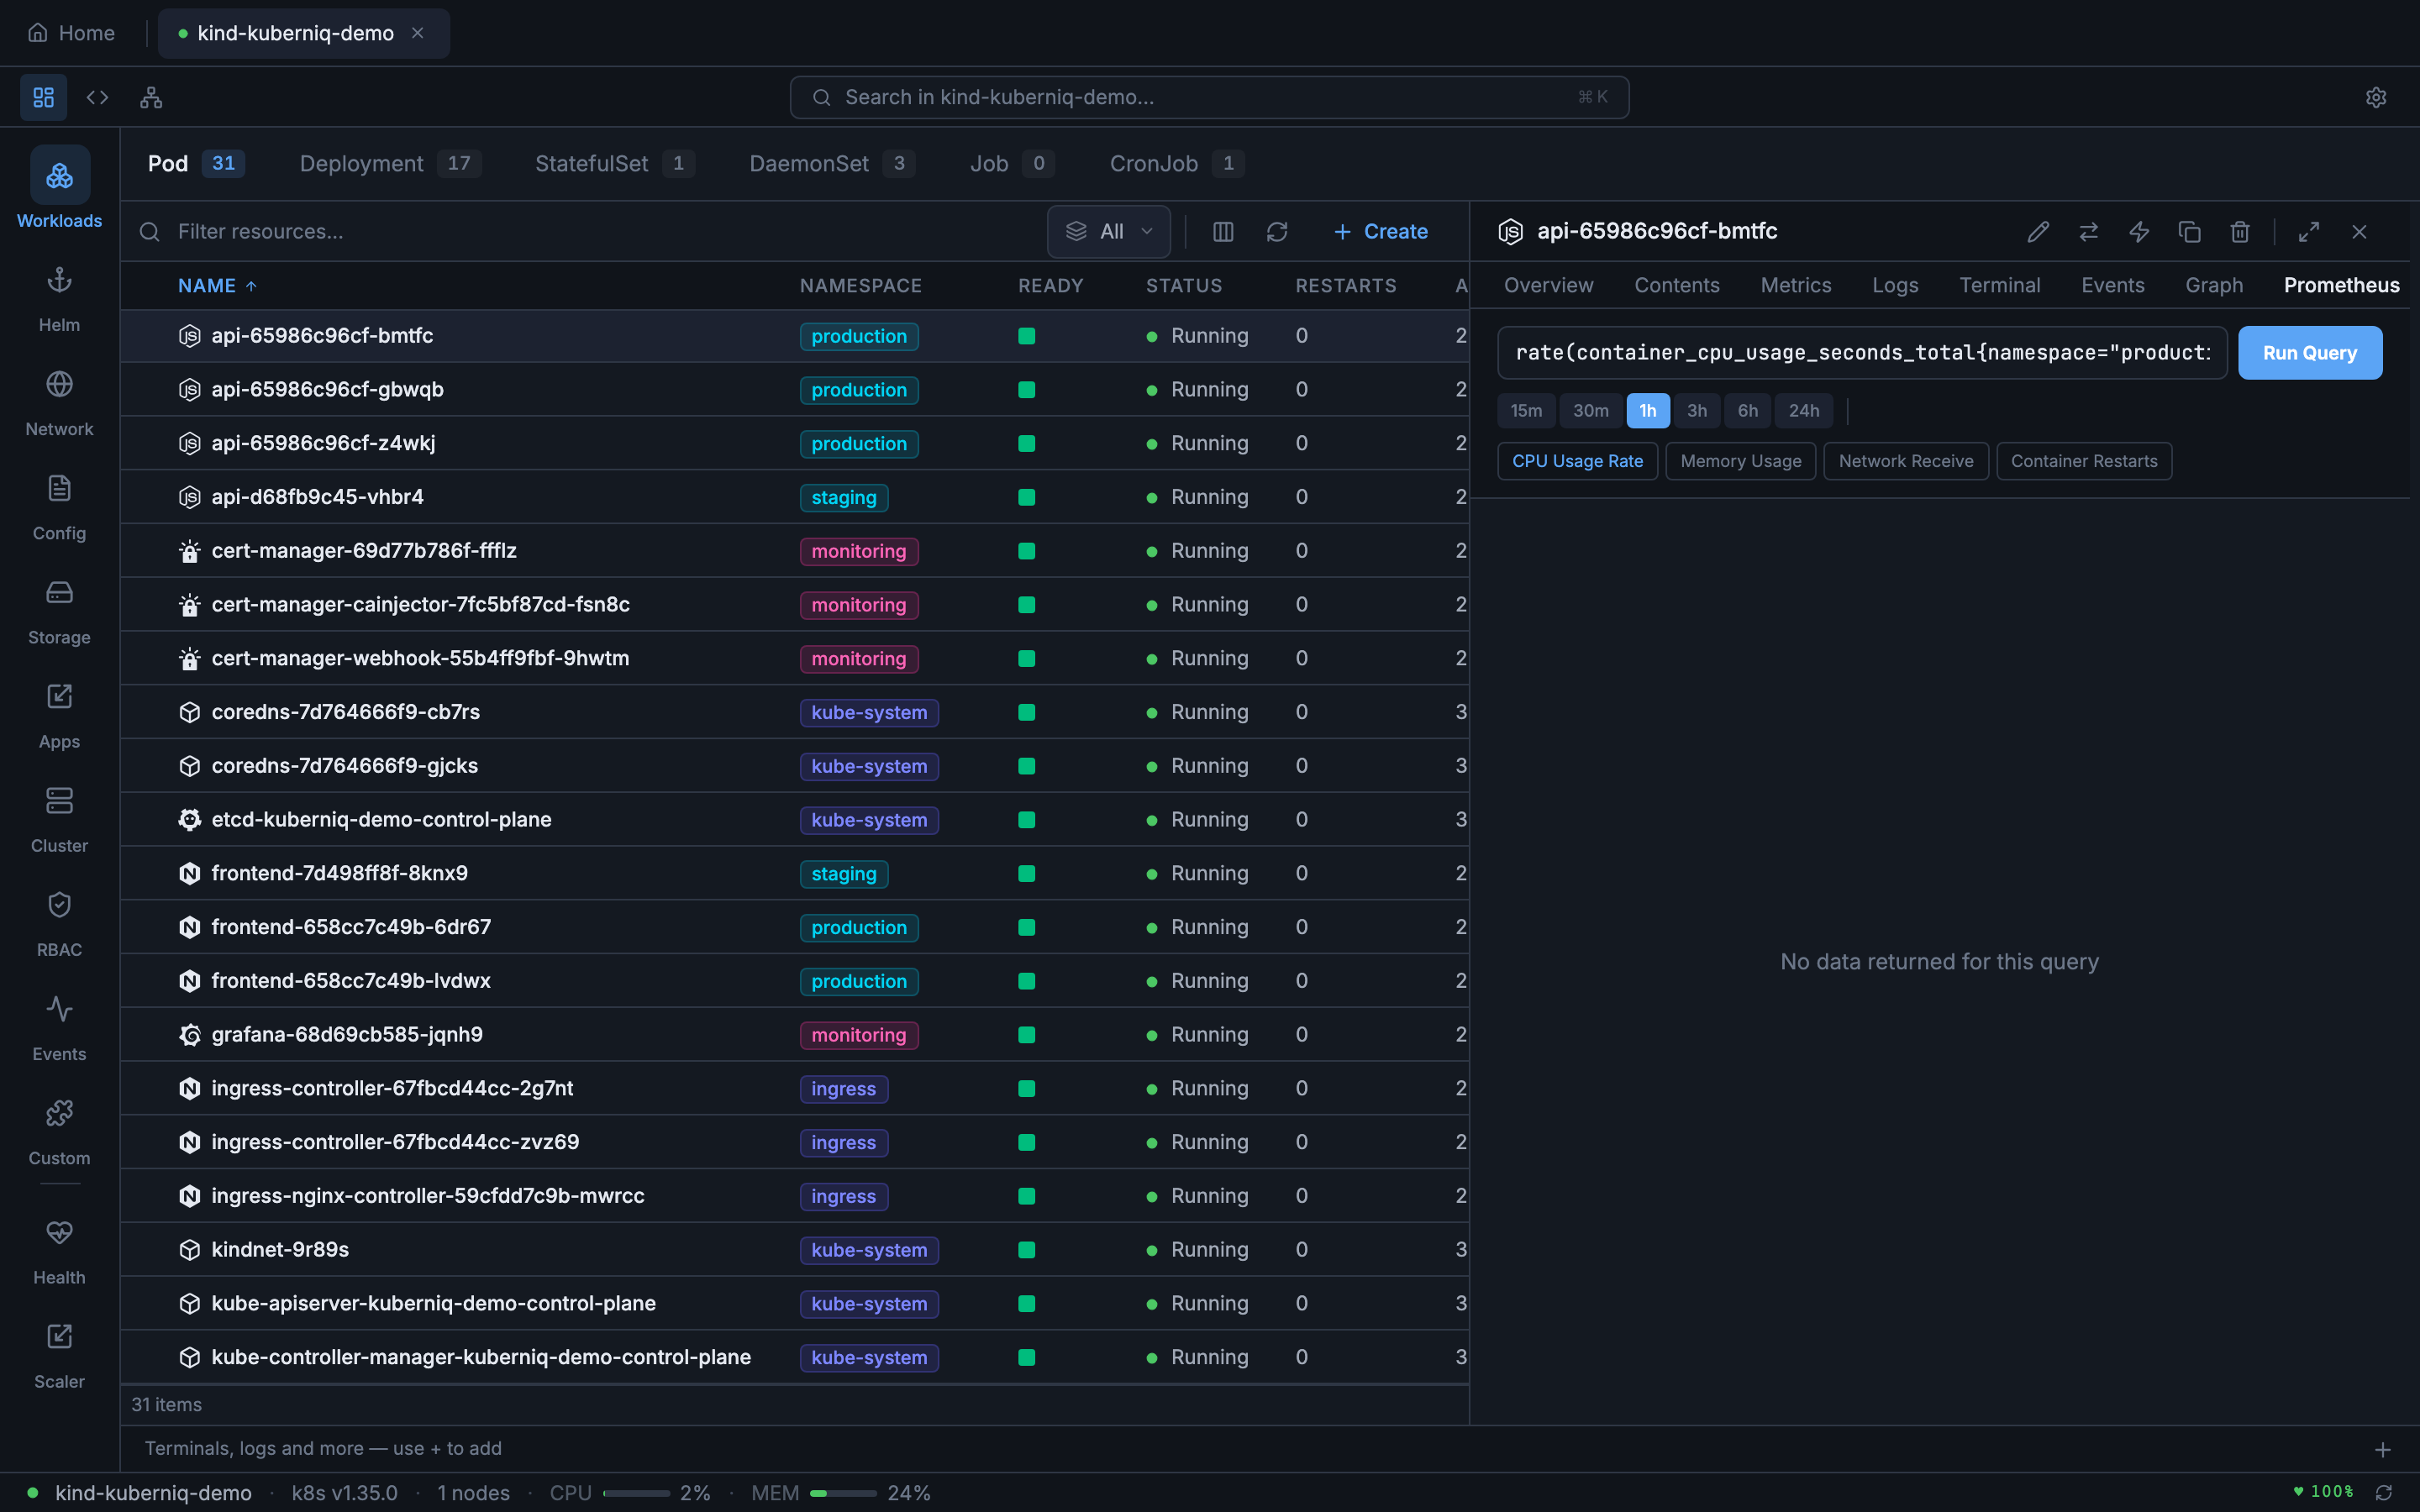
The Prometheus tab in the detail panel lets you write custom PromQL queries and visualize the results as interactive time-series charts. This gives you direct access to any metric in your Prometheus instance without leaving Kuberniq.
Supported Resources
The Prometheus tab is available in the detail panel for the following resource types:
- Pods
- Deployments
- StatefulSets
- DaemonSets
- ReplicaSets
- Jobs
- CronJobs
Writing Queries
The query editor provides a text input where you can write any valid PromQL expression. Kuberniq includes a set of suggested queries based on the selected resource type, such as CPU usage, memory consumption, and network I/O. Click a suggestion to populate the query field, or write your own custom query from scratch.
Duration Selector
Control the time range of your query results using the duration selector. Available options:
- 15 minutes — High-resolution recent data
- 30 minutes — Short-term view
- 1 hour — Default range
- 3 hours — Medium-term patterns
- 6 hours — Half-day overview
- 24 hours — Full-day view for daily patterns
Chart Visualization
Query results are rendered as interactive time-series charts. When a query returns multiple series, each series is displayed with a distinct color and listed in a legend below the chart. Hover over the chart to see exact values at any point in time.
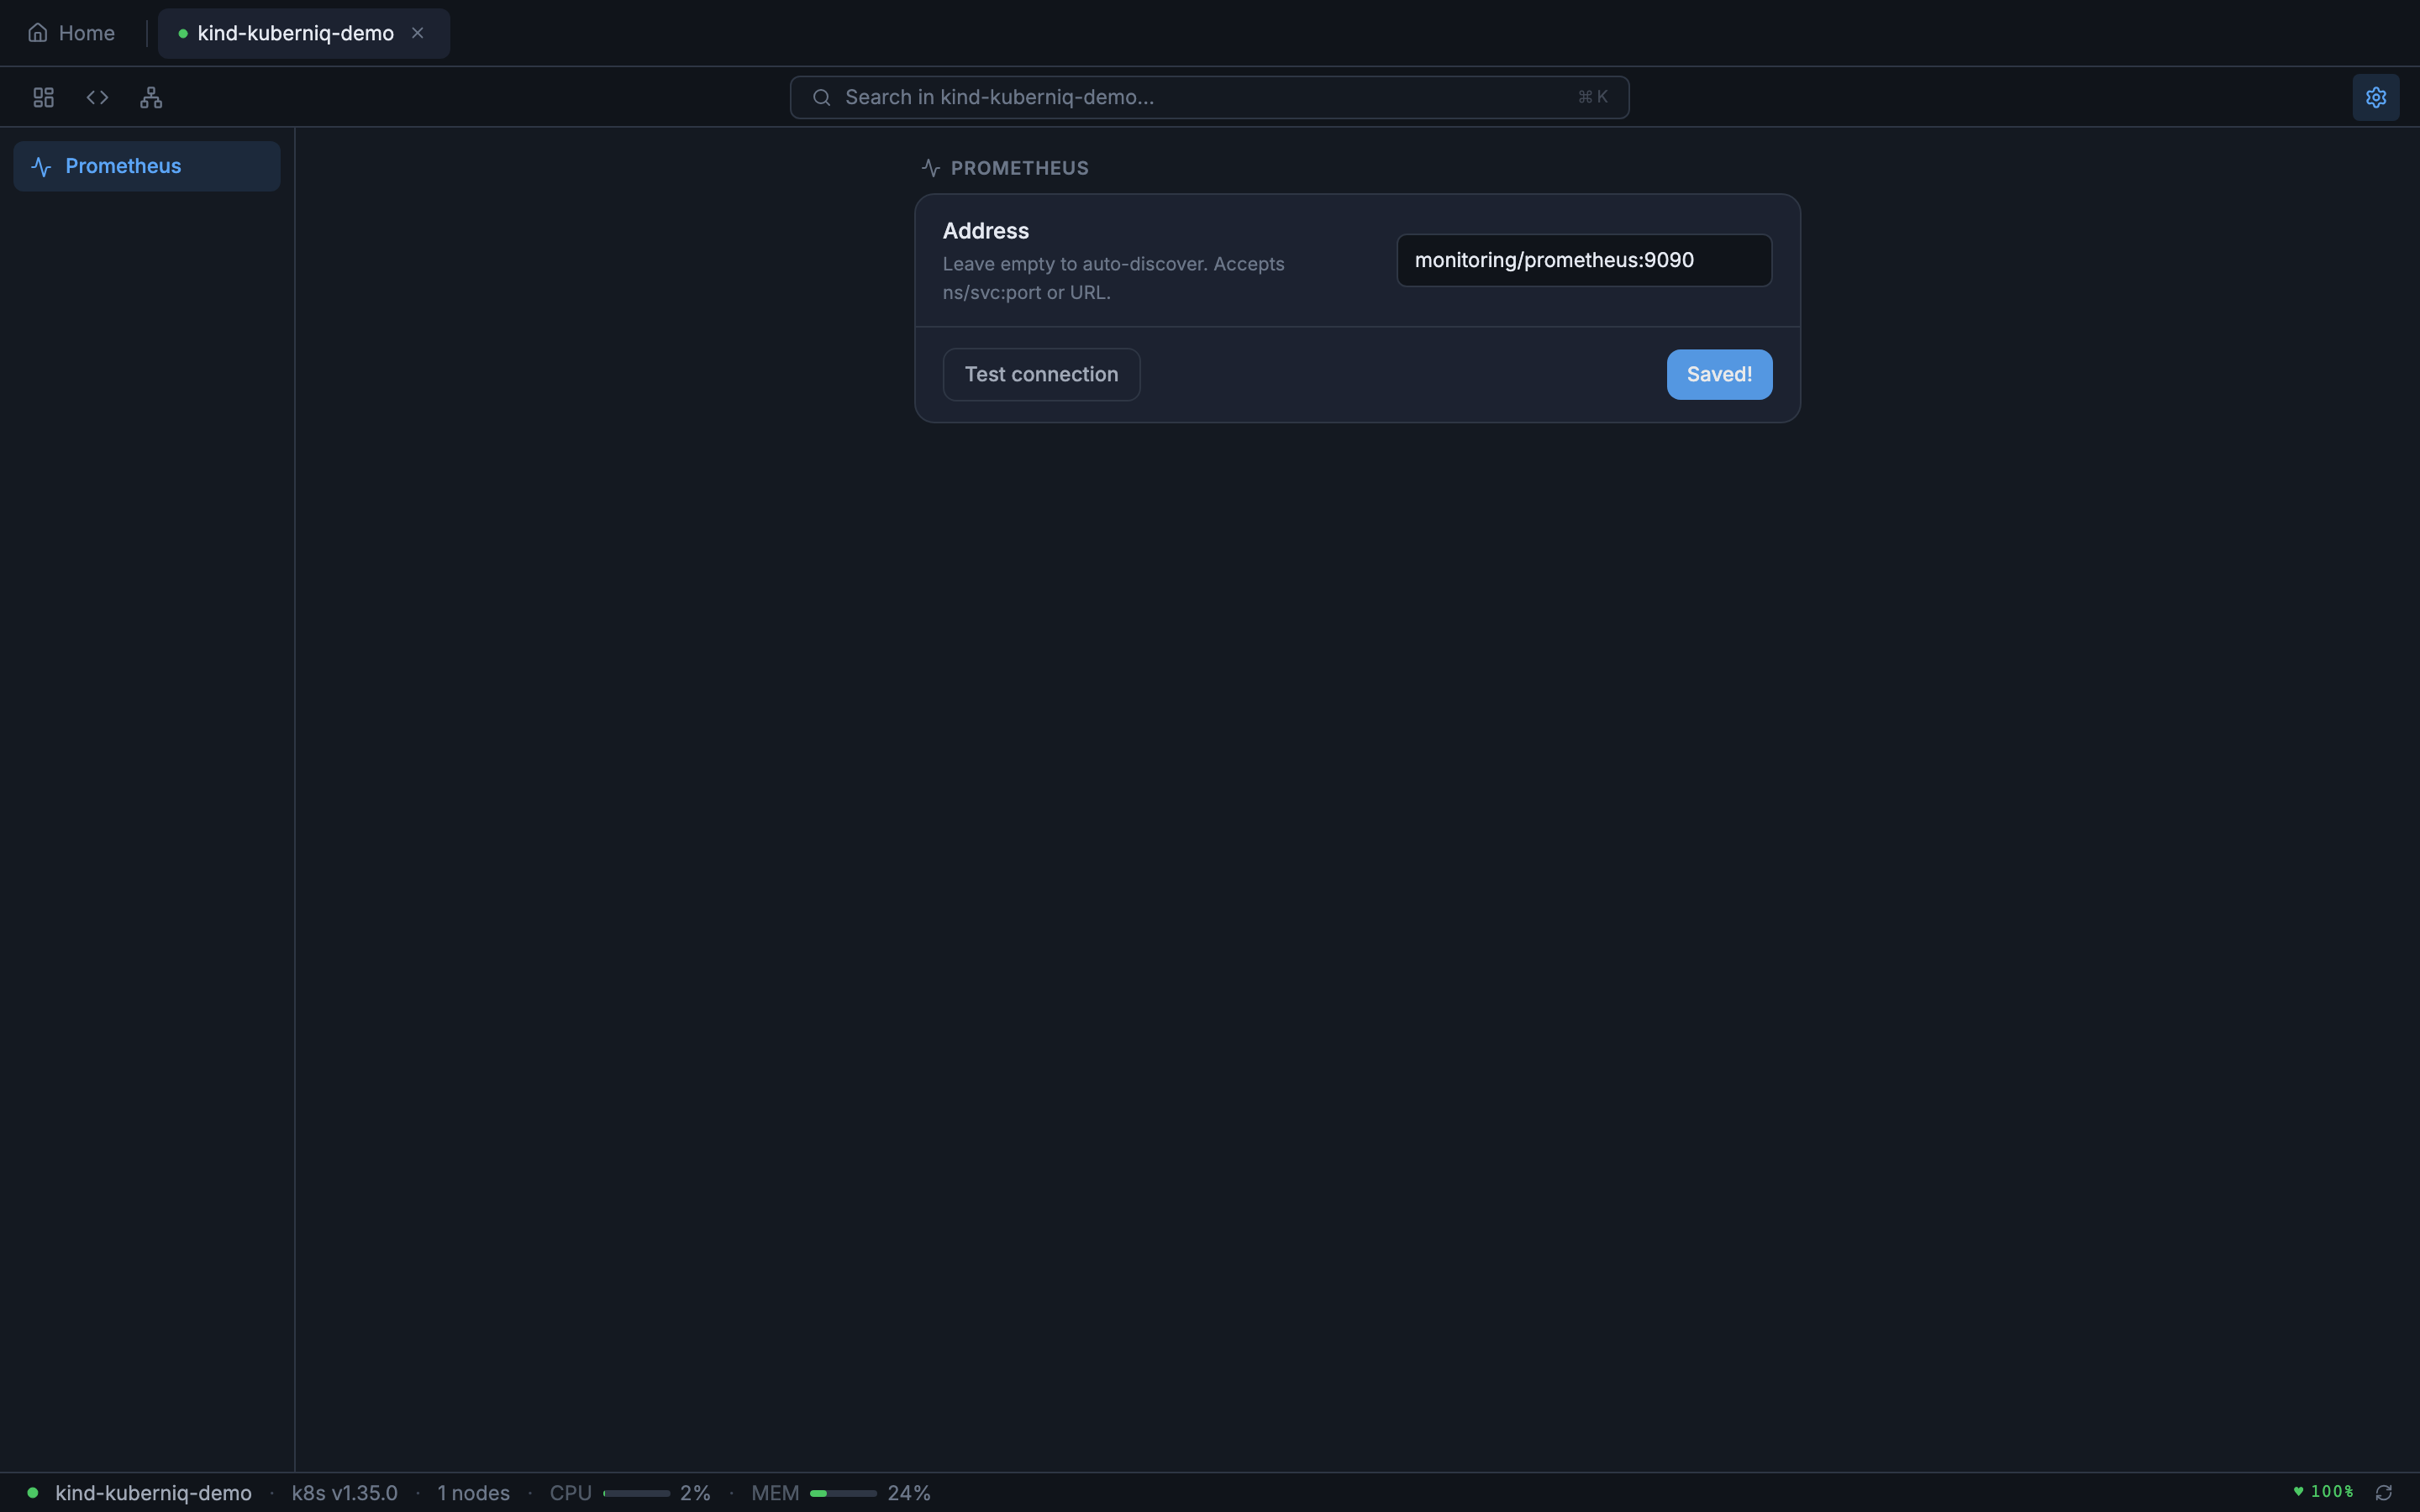
Configuration
The Prometheus tab requires a Prometheus instance to be accessible from your cluster. Kuberniq auto-detects Prometheus by scanning for common service names, but you can also configure the connection manually in Cluster Settings.